Unless you are a die-hard buy-and-hold investor, chances are that you need to rebalance your portfolio at some point.
The question is when? And how often? And why at a specific time? Some strategies rebalance once a year, some multiple times a day.
What if there were better times to rebalance?
In order to address these questions, we will start by reviewing the findings of a very interesting and recent paper called the “Payday Anomaly” by Aixin Ma and William Pratt.
Next, we will compare its results to different data sets, from Fama-French to actual index funds.
Finally, we will focus on the days that show stronger returns, including actual end-of-the-month days as well as days 1, 2, and 16.
The main goal here is to present some analysis so that readers can decide whether there might be better days to rebalance.
Show Me the Data
The “Payday Anomaly” paper explores the possible turn-of-the-month anomaly.
Here is an extract from the conclusion:
The 16th day systematically outperforms the other calendar days, except two other paydays, the 1st and the 2nd days of the month. This confirms our hypothesis that semi-monthly pay system contributes to detectible abnormal returns not only at the turn of the month, but in the middle of the month as well.
First, let’s see if we can reproduce the findings by using the same SPX Yahoo Finance, from January 3, 1950 to March 19, 2018, totalling 17,156 days.
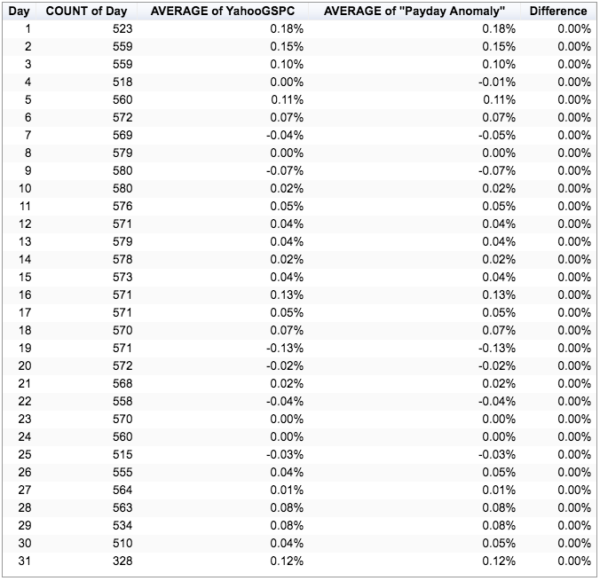
Using a similar pivot function, we are able to sort by calendar days, showing average daily returns next to the averages of the paper, followed by a difference column, if any:
By looking at the last column that represents the difference between our data and the paper’s data, everybody would agree that we were able to reproduce the same averages over the same period. Yes, on average, day 16 outperforms the other calendar days, except the 1st and 2nd day of the month
Fama-French Comparison
Now, because we are a curious bunch, let’s see what we get with the Fama-French data, over the same period, i.e., from January 3, 1950 to March 19, 2018. The data is available here for free. Once downloaded, the data looks like this:
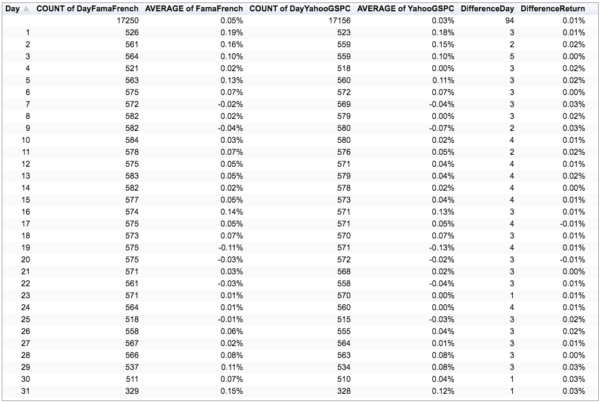
From there, we extract Mkt simply by adding the RF column to the (Mkt-RF) column. Using the same pivot function with the same columns as the first table, here is what we get:
The results are hypothetical results and are NOT an indicator of future results and do NOT represent returns that any investor actually attained. Indexes are unmanaged and do not reflect management or trading fees, and one cannot invest directly in an index.
Avid readers will notice some difference between the two data sets, that again supposedly cover the same period of time, from January 3, 1950 to March 19, 2018. The Fama-French has 17,250 days while Yahoo GSPC has 17,156 days. Yahoo’s data set is short of 94 days. What? Looking a bit closer to the sets, it looks like the shift occurs from May 26, 1952. Why? I have no idea.
Second, we can see differences between daily averages from the two data sets, highlighted in the last column. Why? There could be many reasons.
Remember, we are now comparing Fama-French to Yahoo GSPC (same as SPX Yahoo Finance). On one hand, it includes all CRSP firms incorporated in the US and listed on the NYSE, AMEX, or NASDAQ, while on the other hand, the S&P 500 Universe only
The difference
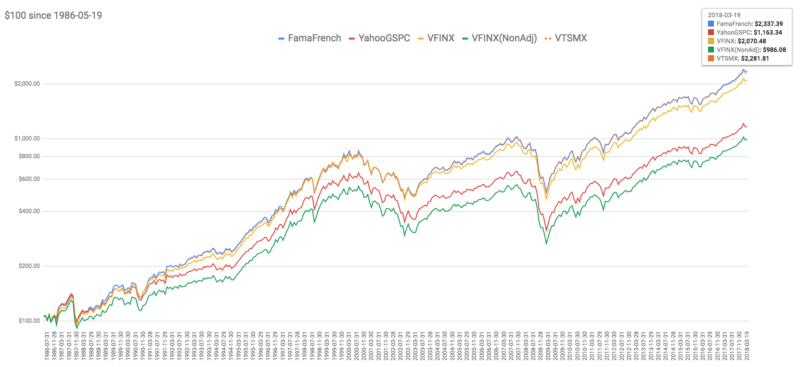
Could dividends be a source of discrepancy? Does Yahoo GSPC include dividends? A quick way to find out is to plot returns of Yahoo GSPC, Fama-French as well as actual funds that track both US total market and S&P 500, with and without dividends:
The results are hypothetical results and are NOT an indicator of future results and do NOT represent returns that any investor actually attained. Indexes are unmanaged and do not reflect management or trading fees, and one cannot invest directly in an index.
What do we see
Fama-French and VTSMX are almost a perfect match, since 1992, the year of the fund’s inception. For those not familiar with the VTSMX fund, it is the Vanguard fund that tracks the CRSP US Total Market Index. In other words, it supposes to replicates Fama-French method. As for the S&P 500 index, we use VFINX, also from Vanguard. The chart shows both VFINX and VFINX(NoAdj) which respectively corresponds to the S&P500 index with dividends and without dividends (non-adjusted).
The second observation is that while being close to VFINX(NoAdj), the proxy for the non-adjusted S&P 500 index, Yahoo GSPC does not really match it. Why? Again, no idea here. Finally, it’s interesting to notice the effect of small- and mid-caps when comparing VTSMX and VFINX since 1992, but I’m digressing here.
Let’s recap what we have found so far:
- We were able to reproduce the daily averages from the paper by using the same data set from SPX Yahoo Finance. From January 3,
1950 to March 19, 2018, we also saw that the 16th, 1st and the 2nd days of the month outperform the other calendar days. - Next, we compared the Yahoo Finance data to Fama-French data over the same period. We noticed differences in daily averages as well as in the number of days. These differences did not alter the observation made on the 16th, 1st and 2nd days of the month. They show similar strong daily returns
. Finally , we observed that SPX Yahoo Finance data is not matching the S&P 500 index, adjusted or not for dividends, at least since 1986, inception year of VFINX.
Now that we have a better idea about the data sets that we are dealing with, let’s take a closer look at these days of the month that show stronger returns than average.
Actual End-of-the-month Days
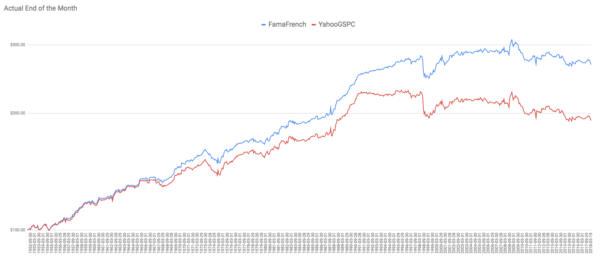
The next log chart shows the average daily returns of the actual end-of-the-month days. It could be a 31st, 30th, 29th, 28th, 27th or even a 26th like in February 1954:
The results are hypothetical results and are NOT an indicator of future results and do NOT represent returns that any investor actually attained. Indexes are unmanaged and do not reflect management or trading fees, and one cannot invest directly in an index.
Since May 1952, they were 790 end-of-the-month days, far more than day 16, 238 extra days exactly. Why May 1952? As mentioned earlier, Yahoo Finance is missing days prior to that date. That’s the reason why. There is an apparent up-trend from 1952 until 1990, then it starts to flatten for Fama-French and even decline for Yahoo Finance. Overall, there is a significant spread over time between to two data sets that could be explained by the dividend distribution that happens at the end of the month, just an hypothesis, given that, as seen earlier, Yahoo data seems to be unadjusted.
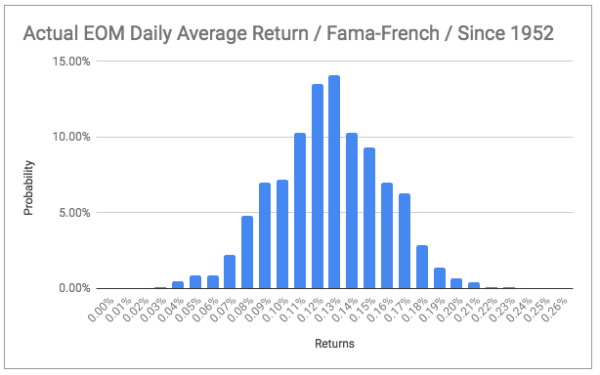
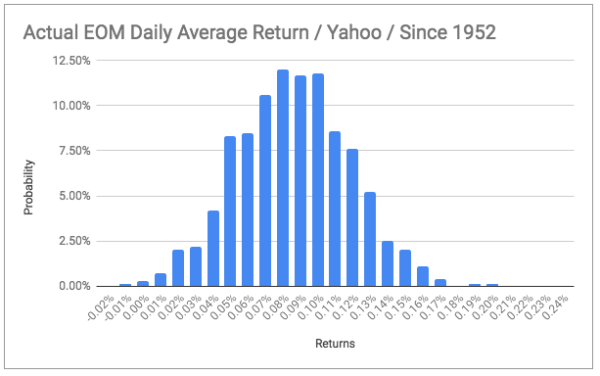
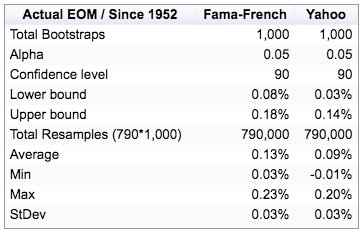
Now, how do we know that we are not dealing with an outlier distribution? A bit like someone who, after having flipped 1,000 times a coin, would get 999 tails? In order to test for pure random walk or actual anomaly, we are going to bootstrap these 790 days. In plain english, it means that we will place the 790 samples (observations) in a big jar, pick one at random, write down the number, put it back in the jar, repeat that 790 times, write down the average and start again 1,000 times. At the end, we should have picked 790,000 samples. We would have essentially sampled 1,000 times the 790 samples, hence the name, resamples. I have done it. I have blisters.
The bootstrap distribution is the distribution of averages from each resample (1,000 total). If the bootstrap distribution appears to be normal, then we are onto something, i.e., there might be an effect. However, if the bootstrap distribution is non-normal, then it’s closer to a random walk.
Here are the bootstrap distributions:
The results are hypothetical results and are NOT an indicator of future results and do NOT represent returns that any investor actually attained. Indexes are unmanaged and do not reflect management or trading fees, and one cannot invest directly in an index.
The results are hypothetical results and are NOT an indicator of future results and do NOT represent returns that any investor actually attained. Indexes are unmanaged and do not reflect management or trading fees, and one cannot invest directly in an index.
From both distribution charts and statistics, it would appear that we are dealing with pretty normally distributed resamples. That would mean that, on average, and over this specific period of time, actual end-of-the-month daily returns are stronger than other days of the month, averaging +0.13% per day (Fama-French).
Day 16
The authors of the Payday Anomaly write that the reason behind these stronger than average returns is the hypothesis that semi-monthly pay system contributes to detectible abnormal returns not only at the turn of the month, but in the middle of the month as well.
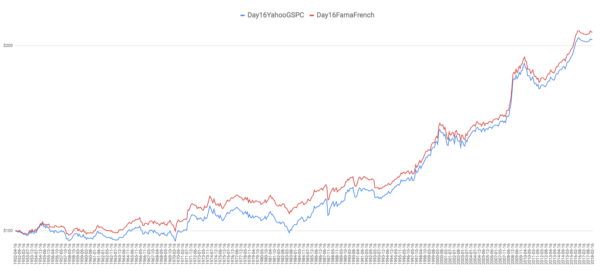
To find out, let’s plot the 16th day average returns since 1952, for Fama-French and Yahoo. The chart below shows the average daily returns of the 16th day. The first observation is that, on average, both data sets are trending up since 1952. Had an investor started to trade each 16th day of the month since April 1952, he/she would have more than doubled his/her investment, averaging +0.14% per day (Fama-French)
The results are hypothetical results and are NOT an indicator of future results and do NOT represent returns that any investor actually attained. Indexes are unmanaged and do not reflect management or trading fees, and one cannot invest directly in an index.
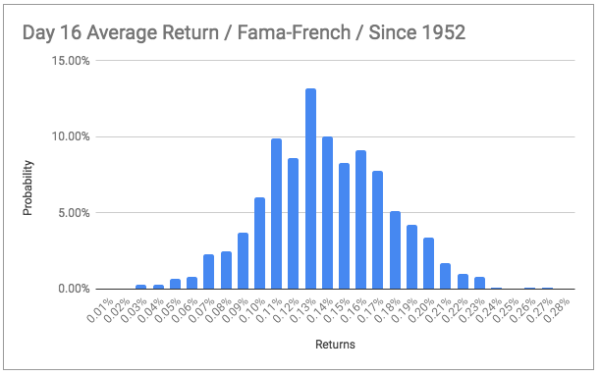
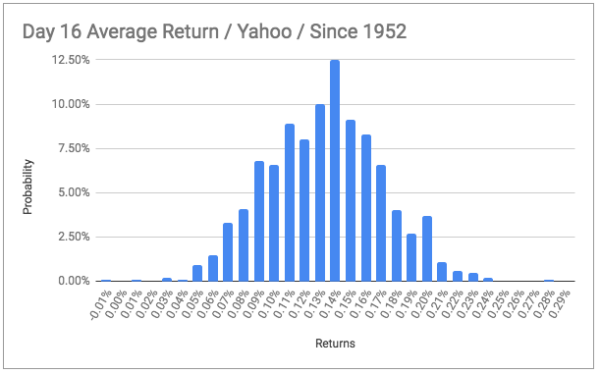
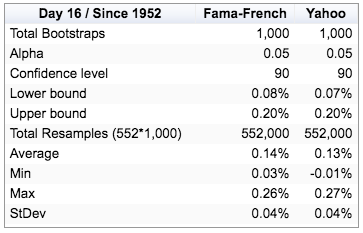
Next, let’s see whether we are dealing with a random walk or not, by applying the same bootstrapping technique. Again, the distributions below represent the distribution of averages from each resample.
The results are hypothetical results and are NOT an indicator of future results and do NOT represent returns that any investor actually attained. Indexes are unmanaged and do not reflect management or trading fees, and one cannot invest directly in an index.
The results are hypothetical results and are NOT an indicator of future results and do NOT represent returns that any investor actually attained. Indexes are unmanaged and do not reflect management or trading fees, and one cannot invest directly in an index.
The two bootstrap distributions corresponding to Fama-French and Yahoo data sets for day 16, appear to be normal, confirming the abnormal average returns of day 16, since 1952.
Finally, Day 1 and Day 2
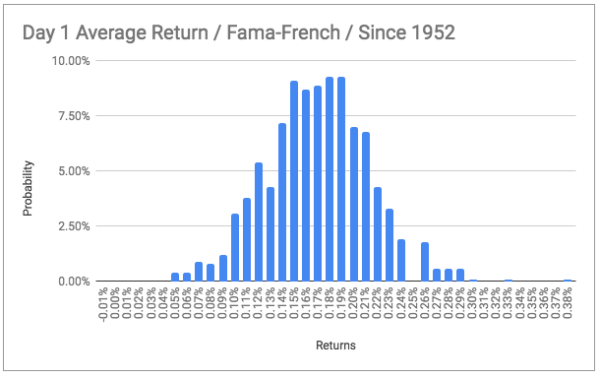
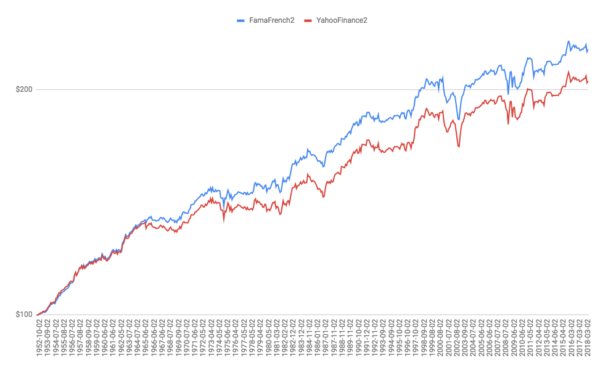
As for the previous days, we plot the log returns of day 1 and day 2, using Fama-French and Yahoo data, since 1952. Similarly to day 16, they are both trending up, on average.
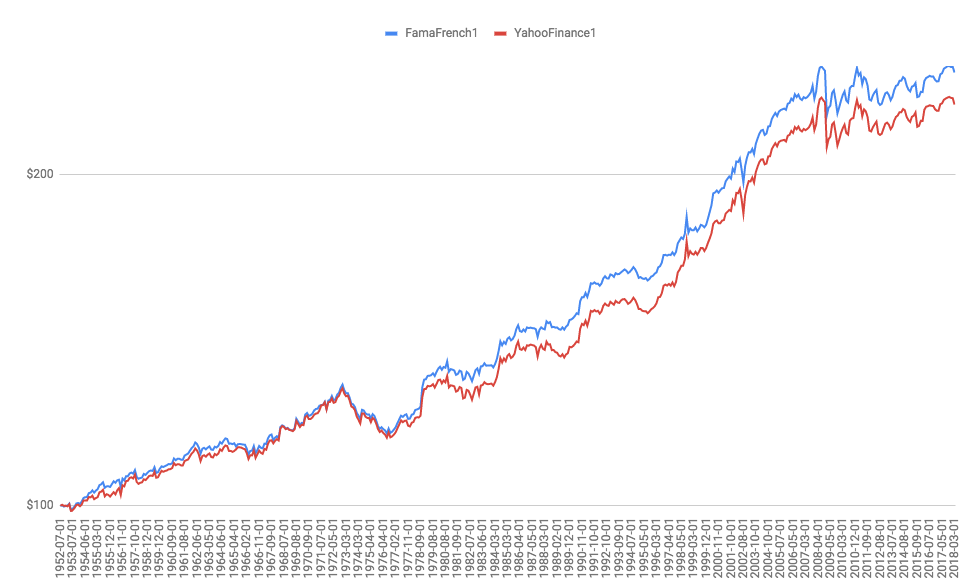
The results are hypothetical results and are NOT an indicator of future results and do NOT represent returns that any investor actually attained. Indexes are unmanaged and do not reflect management or trading fees, and one cannot invest directly in an index.
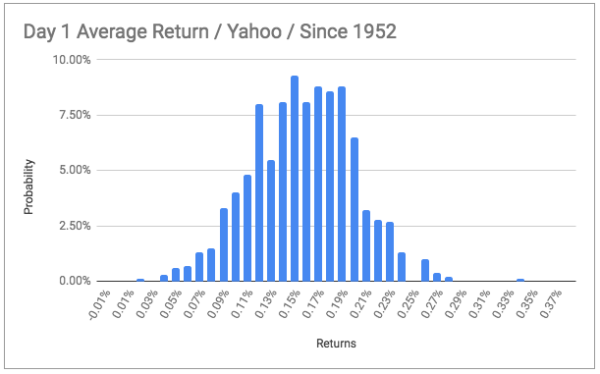
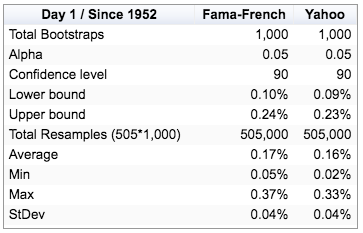
The bootstrap distributions also look relatively normal, confirming the abnormal average returns of day 1 and day 2, since 1952.
The results are hypothetical results and are NOT an indicator of future results and do NOT represent returns that any investor actually attained. Indexes are unmanaged and do not reflect management or trading fees, and one cannot invest directly in an index.
The results are hypothetical results and are NOT an indicator of future results and do NOT represent returns that any investor actually attained. Indexes are unmanaged and do not reflect management or trading fees, and one cannot invest directly in an index.
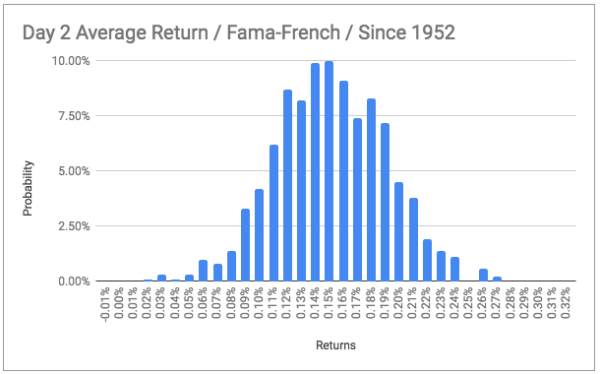
The results are hypothetical results and are NOT an indicator of future results and do NOT represent returns that any investor actually attained. Indexes are unmanaged and do not reflect management or trading fees, and one cannot invest directly in an index.
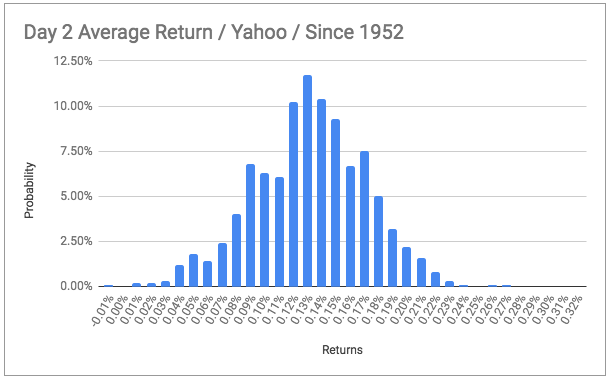
The results are hypothetical results and are NOT an indicator of future results and do NOT represent returns that any investor actually attained. Indexes are unmanaged and do not reflect management or trading fees, and one cannot invest directly in an index.
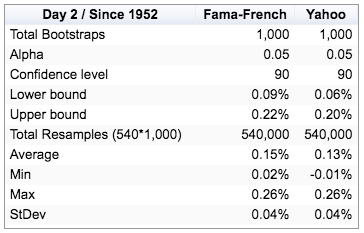
The results are hypothetical results and are NOT an indicator of future results and do NOT represent returns that any investor actually attained. Indexes are unmanaged and do not reflect management or trading fees, and one cannot invest directly in an index.
All the same? Not Really. Meet Day 19
Before wrapping up, let’s take a look at the worst average day, day 19, since 1952, using the same data sets:
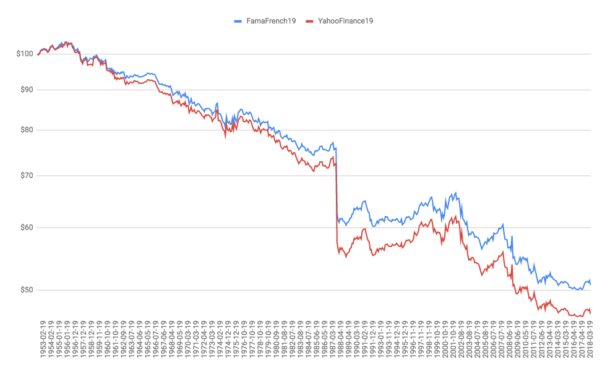
The results are hypothetical results and are NOT an indicator of future results and do NOT represent returns that any investor actually attained. Indexes are unmanaged and do not reflect management or trading fees, and one cannot invest directly in an index.
Followed by the bootstrap distributions that look relatively normal:
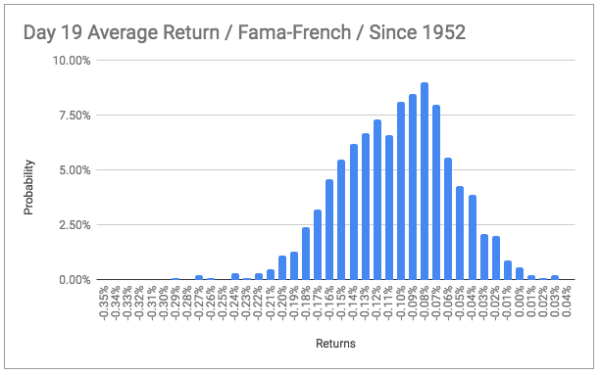
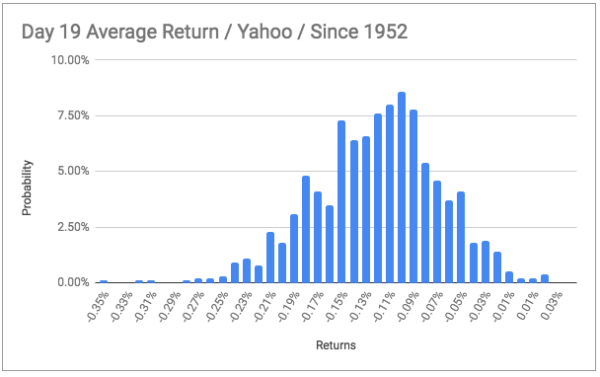
The results are hypothetical results and are NOT an indicator of future results and do NOT represent returns that any investor actually attained. Indexes are unmanaged and do not reflect management or trading fees, and one cannot invest directly in an index.
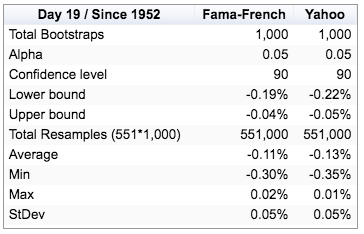
The results are hypothetical results and are NOT an indicator of future results and do NOT represent returns that any investor actually attained. Indexes are unmanaged and do not reflect management or trading fees, and one cannot invest directly in an index.
Conclusion
First, by replicating and comparing the initial paper to other data sets, we found out that yes, there were days with stronger average returns, specifically day 16, day 1, day 2, and end-of-the-month days. Second, we showed that the initial data set from Yahoo Finance was different from both Fama-French and actual S&P 500 funds such as VFINX, adjusted or not. It did not however alter the original findings. The bootstrap distributions tend to confirm that the original observations were not outliers, hence reinforcing the hypothesis of abnormal returns.
Now the big question is what are the factors responsible for these abnormal returns? The authors of the “Payday Anomaly” offer an answer by concluding that
This is a compelling hypothesis.
For those of us who rebalance their portfolios at the end of the month, how do you feel about these results? Ready to stomach another August 31, 1998?
And finally, who wants to short day 19?
About the Author: François Lucas
—
Important Disclosures
For informational and educational purposes only and should not be construed as specific investment, accounting, legal, or tax advice. Certain information is deemed to be reliable, but its accuracy and completeness cannot be guaranteed. Third party information may become outdated or otherwise superseded without notice. Neither the Securities and Exchange Commission (SEC) nor any other federal or state agency has approved, determined the accuracy, or confirmed the adequacy of this article.
The views and opinions expressed herein are those of the author and do not necessarily reflect the views of Alpha Architect, its affiliates or its employees. Our full disclosures are available here. Definitions of common statistics used in our analysis are available here (towards the bottom).
Join thousands of other readers and subscribe to our blog.


