In the great book and series Game of Thrones, the inhabitants of the Iron Islands have a saying “What is Dead May Never Die” which is to be replied with “But rises again harder and stronger.” I am reminded of this saying as more and more market commentators and practitioners declare that value investing is dead and cite its terrible performance over the last 10 years (and even longer for some versions) as proof. Perhaps the most recent one is a good and thought-provoking post by Josh Brown here. Josh shows a chart in his post that shows the performance of large value stocks in the S&P 500 (IVE) vs. large growth stocks in the S&P 500 (IVW):
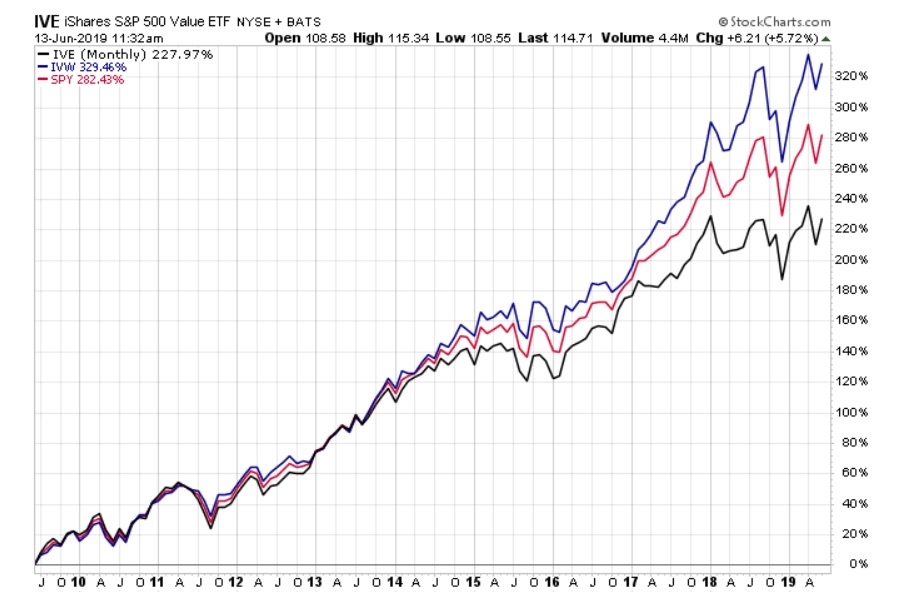
In the post, Josh raises several good questions about capital and what drives the worth of a business…and what the world may look like if capital is always free. Before we continue to declare value investing dead, let’s remember “what is dead may never die”… and that the most popular and academic version of value investing was Dead On Arrival.
What is Value and HML?
It’s important to know and understand what the academic and index definition of value investing is, and how various investment portfolios or factor series are constructed, in order to understand why most popular forms of “value” are Dead On Arrival.
The seminal paper on value investing is this paper by Dr. Eugene Fama and Dr. Ken French (Fama & French). It popularized value investing and created the academic version of value that we know today – High B/M stocks Minus Low B/M stocks, or HML.
To create HML, Fama & French looked at the December year-end book value per share of each company listed on US stock exchanges each June (to avoid look-ahead bias) and compared that to the price of the stock for the same company at the end of December for the prior year. They used this to create a price to book ratio for each company and then used this metric to sort companies into 6 buckets – 2 groups by size (large & small) and for each size bucket 3 groups (30% cheapest stocks by P/B in December, middle 40% and 30% most expensive stocks by P/B in December). Inside each of the 6 buckets, the stocks would be weighted by market cap.
HML is a dollar neutral portfolio that equal weights the following two portfolios:
- Owns cheapest 30% of small stocks by P/B and sells short the 30% of most expensive small stocks by P/B.
- Owns cheapest 30% of large stocks by P/B and sells short the 30% of most expensive large stocks by P/B.(1)
Why is HML Problematic?
If you were able to slog through the details about HML, above, you may be wondering “what’s the problem?” There is one big (pun intended) issue with the way HML is constructed – it is equal weighting large and small stock value portfolios…and there has never been a statistically significant risk premium for P/B value in large stocks!
In Fact, Fiction and Value Investing exhibit 5 the authors point out that HML large return stream was not statistically significantly different from a 0% return during the entire time period of 1926 through 2014 and was only statistically significant during the 1963 to 1981 time period (and it still only had a t-stat of 2.51).
In addition to the statistical evidence, P/B value investing has several theoretical issues as well. OSAM has a great research piece here that describes one of the issues. Also, Jesse Livermore has a fantastic soon to be released research tome on more theoretical limits and issues with using book value.
This means that if one believes the data and theory, one shouldn’t expect a large stock value portfolio created on P/B to produce any excess return…Large Cap P/B value was Dead on Arrival!
Reproducing HML Results
Like all great quants, let’s see if we can reproduce the results of HML and the results of HML by size portfolio. Using data from Dr. French’s website we download the 6 Portfolios formed on P/B and use the same type of technique above (2 portfolios by size then separate into the cheapest 30% and most expensive 30%, etc.) to create the Proxy HML portfolio (I am going to compare the results to HML Devil as the method of creating the portfolios from Dr. French’s website is more similar to how HML Devil is created). The results are shown in the graph, below:
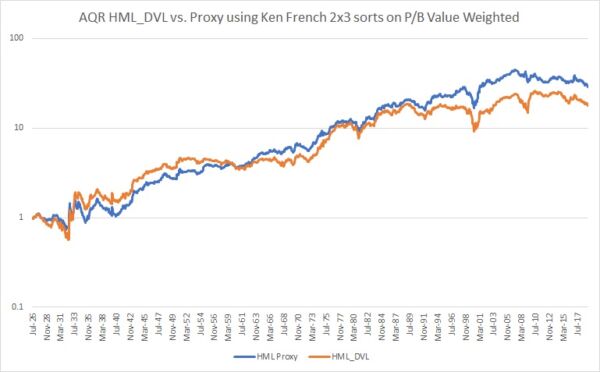
As you can see from the graph, above, the HML Proxy portfolio (blue) and the HML Devil return series (orange) are very similar in both magnitude and correlation (87% correlated). The HML Proxy portfolio is a pretty good and easy way to reconstruct HML without having access to CRSP database and creating the portfolios from the ground-up.
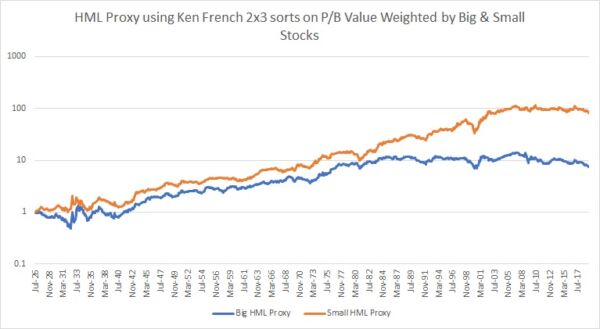
Now that we have verified that using Dr. French’s website is a good way to create proxy return series, we can now create a Large stock HML proxy and a Small stock HML proxy:
The results are hypothetical results and are NOT an indicator of future results and do NOT represent returns that any investor actually attained. Indexes are unmanaged and do not reflect management or trading fees, and one cannot invest directly in an index.
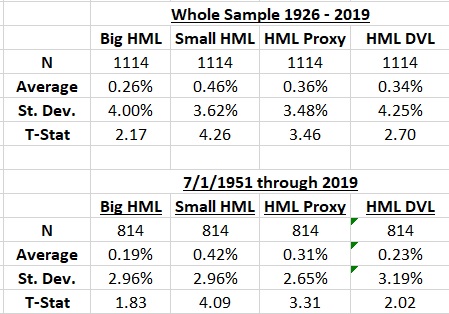
The graph above seems to be consistent with the original results in Fama & French 1992 and in Fact, Fiction and Value Investing – Large Cap value created on P/B stocks are significantly worse than Small Cap value stocks created on P/B. Is the difference bad enough to say there is no statistically significant difference between Big HML Proxy and a 0% return?
The results are hypothetical results and are NOT an indicator of future results and do NOT represent returns that any investor actually attained. Indexes are unmanaged and do not reflect management or trading fees, and one cannot invest directly in an index.
What we see from the table is that Big HML Proxy is barely statistically significant during the whole sample and is not statistically significant over the period 1951 through 2019! Again, the data say that one shouldn’t expect a risk premium from P/B Large Cap value stocks…What is Dead May Never Die!
But Rises Again Harder & Stronger
Now that we have hopefully destroyed the myth about P/B Large Cap value stocks having provided (or should provide) any kind of a risk premium, does that mean that value investing in US Large Cap Stocks doesn’t exist? Well, let’s take a look at the data and see!
Using the same procedures as above (6 portfolios – 2 groups by size then 3 groups by cheapness) and data from Dr. French’s website, I create a P/E HML proxy as well as a Large Cap P/E HML and a Small Cap P/E HML:
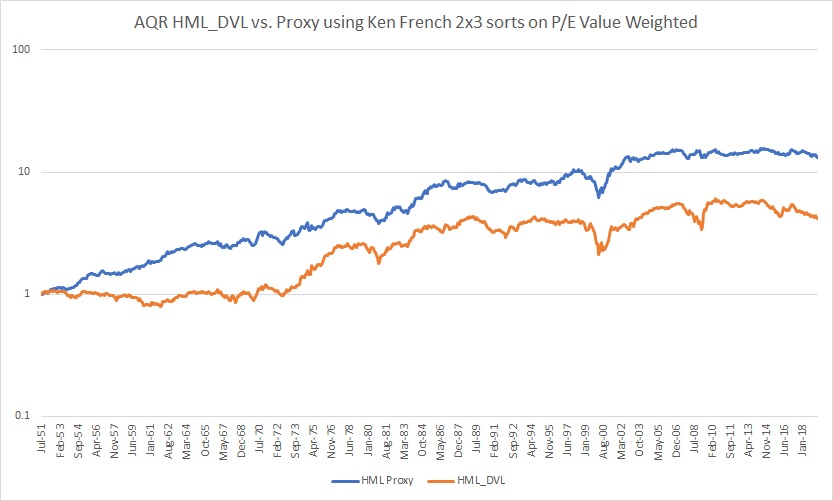
The results are hypothetical results and are NOT an indicator of future results and do NOT represent returns that any investor actually attained. Indexes are unmanaged and do not reflect management or trading fees, and one cannot invest directly in an index.
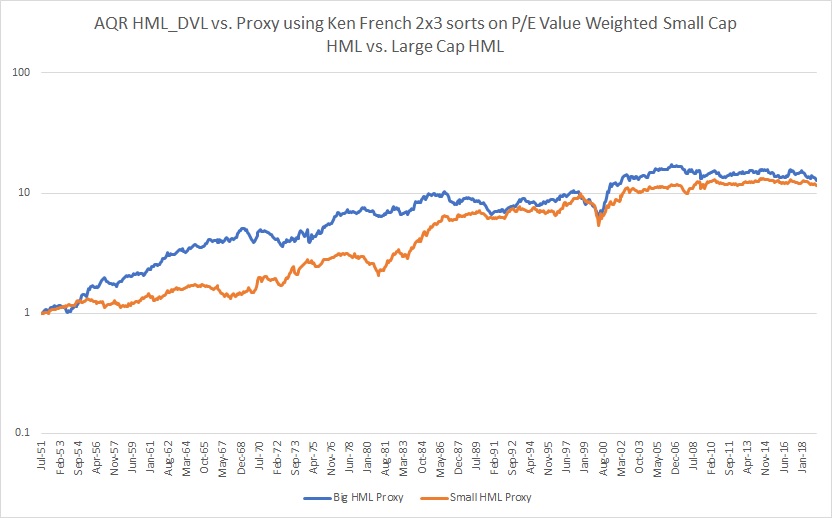
The results are hypothetical results and are NOT an indicator of future results and do NOT represent returns that any investor actually attained. Indexes are unmanaged and do not reflect management or trading fees, and one cannot invest directly in an index.
What we see from the graphs above are the following:
- PE HML Proxy appears to perform far better than HML as defined by P/B (including far smaller drawdowns historically) which is demonstrated in the first graph.
- PE HML Proxy appears to be less correlated to HML DVL as it is only 69% correlated to the factor (it’s doing something different…by design) as demonstrated in the first graph.
- The second graph shows that PE HML Proxy has very similar results for Large Cap stocks as for Small Cap stocks (unlike P/B).
So does PE HML Proxy bring back value investing in Large Cap Stocks? Let’s take a look at the statistical analysis:

The results are hypothetical results and are NOT an indicator of future results and do NOT represent returns that any investor actually attained. Indexes are unmanaged and do not reflect management or trading fees, and one cannot invest directly in an index.
The data seem to indicate that P/E investing seems to bring back Large Cap value investing as the t-stat for the risk premium clears the threshold for being statistically significantly different from 0%.
Does this prevent value’s under performance the last 10 years?
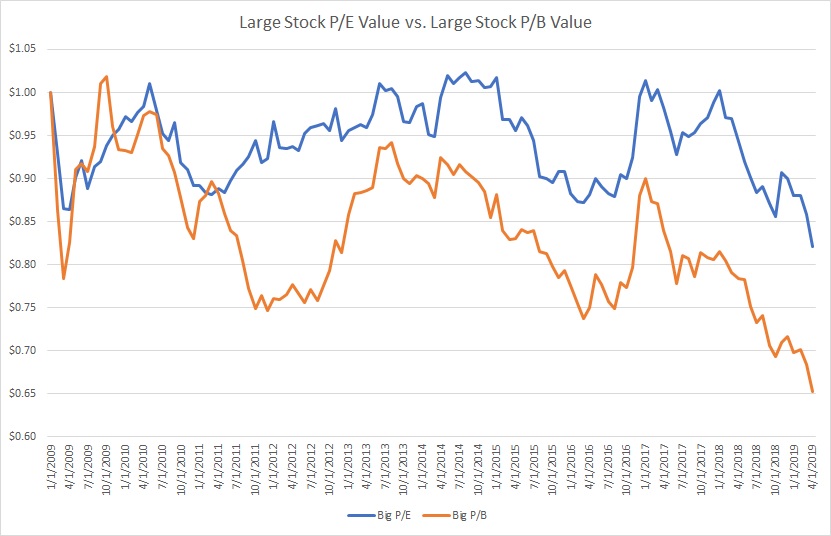
Large Cap P/E value stocks have done much better than Large Cap P/B value stocks (including being break-even as recently as 1/1/2018) but have still managed to lose money in the last 10 years…I guess there is a reason why it’s called a risk premium and not an arbitrage!
Concluding Thoughts
The “death of value” articles shouldn’t be a surprise to those who are familiar with the details of the research on value investing – Large-Cap P/B value was Dead on Arrival.
However, not all is lost as when using different ways and methods to measure value (e.g.,P/E or EBIT/TEV), the value risk premium is still alive and well.
Hopefully one ends this post with a call to arms to review their value holdings and ensure that there is a match between capitalization of stocks being used, the fundamental metric that defines value, and that both are supported by academic research and all of its tedious details. (PS. If Wes and his team would ever get their Visual Active Share tool working again it would make life a lot easier. hint hint…)
References[+]
About the Author: Andrew Miller
—
Important Disclosures
For informational and educational purposes only and should not be construed as specific investment, accounting, legal, or tax advice. Certain information is deemed to be reliable, but its accuracy and completeness cannot be guaranteed. Third party information may become outdated or otherwise superseded without notice. Neither the Securities and Exchange Commission (SEC) nor any other federal or state agency has approved, determined the accuracy, or confirmed the adequacy of this article.
The views and opinions expressed herein are those of the author and do not necessarily reflect the views of Alpha Architect, its affiliates or its employees. Our full disclosures are available here. Definitions of common statistics used in our analysis are available here (towards the bottom).
Join thousands of other readers and subscribe to our blog.
