Prior research on Momentum
- The study “Momentum Has Its Moments” found that momentum strategies can be improved by scaling for volatility—targeting a specific level of volatility, reducing (increasing) exposure when volatility is high (low).
- The study “Idiosyncratic Momentum: U.S. and International Evidence” (Summary) found that results could be improved (reducing the risk of momentum strategies) by removing the return component due to market beta.
- The study “Enhanced Momentum Strategies” confirmed that both scaling volatility and idiosyncratic momentum are unique strategies that decrease momentum crashes and lead to higher risk-adjusted returns—with idiosyncratic momentum emerging as the best momentum strategy.
- The study “Extreme Absolute Strength of Stocks and Performance of Momentum Strategies” (Summary) found that excluding stocks with more extreme past returns enhanced the performance of momentum strategies while also reducing their crash risk.
- The study “Momentum and Reversal: Does What Goes Up Always Come Down?” found that the stocks in a momentum portfolio, which contribute to momentum profits, do not experience significant subsequent reversals. Conversely, stocks that do not contribute to momentum profits over the intermediate horizon exhibit subsequent reversals. Merging these separate securities into a single portfolio causes momentum and reversal patterns to appear linked. Stocks with momentum can be separated from those that exhibit reversal by sorting on size and book-to-market (BtM) equity ratio. A strategy of buying small value winners and selling large growth losers yields larger momentum profits than the standard momentum strategy in the short run and doesn’t display significant return reversals for holding periods beyond one year.
Latest Contribution to the Literature
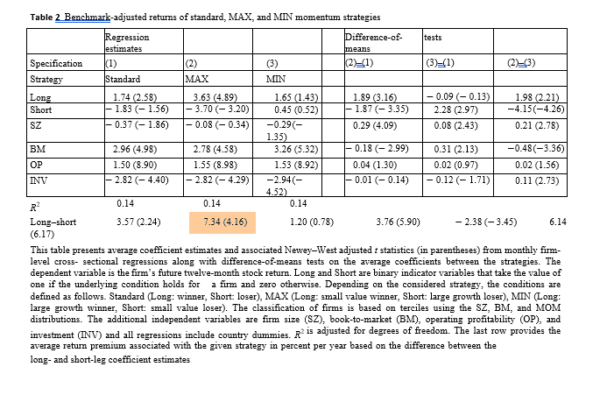
By examining international evidence, Christian Walkshäusl, Florian Weißofner and Ulrich Wessels provide an out-of-sample test of the findings of the “Momentum and Reversal: Does What Goes Up Always Come Down?” study. Their study, “Separating Momentum from Reversal in International Stock Markets,” which appears in the January 2019 issue of the Journal of Asset Management, covers 20 developed international markets and the period July 1990-June 2017. They excluded very small firms by eliminating the 5 percent with the lowest market equity in each country. They also excluded negative book equity and financial firms. Following the methodology of Conrad and Yavuz, authors of the aforementioned “Momentum and Reversal” study, the stocks in the long leg of the portfolio are those with the following characteristics:- Past six-month returns in the top tercile of the momentum distribution.
- Firm size in the bottom tercile of the size distribution.
- BtM ratio in the top tercile of that distribution.
- Past six-month returns in the bottom tercile of the momentum distribution.
- Firm size in the top tercile of the size distribution.
- BtM ratio in the bottom tercile of that BtM distribution.
Summary of the Findings
- Taking into account expected return characteristics like firm size and BtM in the selection of winners and losers helps to ex-ante separate stocks with momentum from those that exhibit reversal in international equity markets—confirming that momentum and reversals are not necessarily linked.
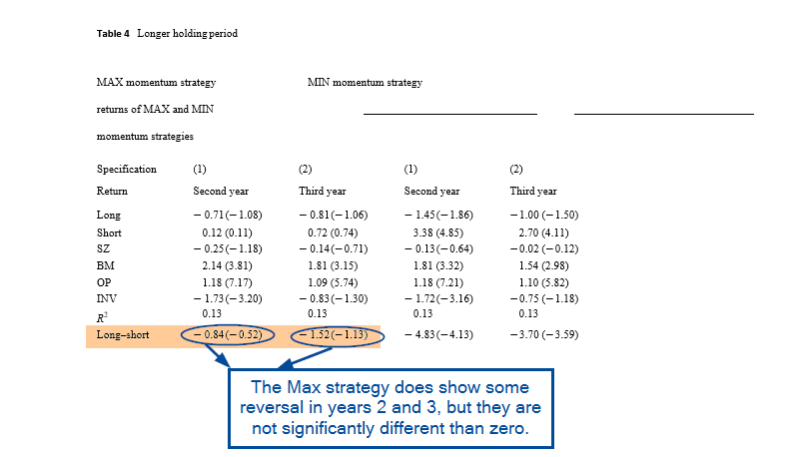
- A strategy that buys small value winners and sells large growth losers (MAX strategy) generates significantly larger momentum profits than a standard momentum strategy, is robust to common return controls and does not suffer from return reversals for holding periods up to 3 years.
- The superior performance of the strategy is attributable to a systematic exploitation of cross-sectional mispricing among momentum stocks.
- The strategy is implementable, with estimated trading costs of about 0.54 percent per annum versus a premium of greater than 7.5 percent.
- The findings are robust to subsample periods, firm size, economic regime, and region (with the exception of Japan, a well-documented exception to the pervasiveness of the momentum factor).


Summary
Summarizing, these findings help us better understand the explanatory power of momentum in the cross-section of expected returns and can be used to create more efficient portfolios, whether long-only or long/short. They also show the benefit of combining multifactor portfolio strategies into one single fund versus the alternative of building portfolios of funds that obtain exposure to single factors.About the Author: Larry Swedroe
—
Important Disclosures
For informational and educational purposes only and should not be construed as specific investment, accounting, legal, or tax advice. Certain information is deemed to be reliable, but its accuracy and completeness cannot be guaranteed. Third party information may become outdated or otherwise superseded without notice. Neither the Securities and Exchange Commission (SEC) nor any other federal or state agency has approved, determined the accuracy, or confirmed the adequacy of this article.
The views and opinions expressed herein are those of the author and do not necessarily reflect the views of Alpha Architect, its affiliates or its employees. Our full disclosures are available here. Definitions of common statistics used in our analysis are available here (towards the bottom).
Join thousands of other readers and subscribe to our blog.

