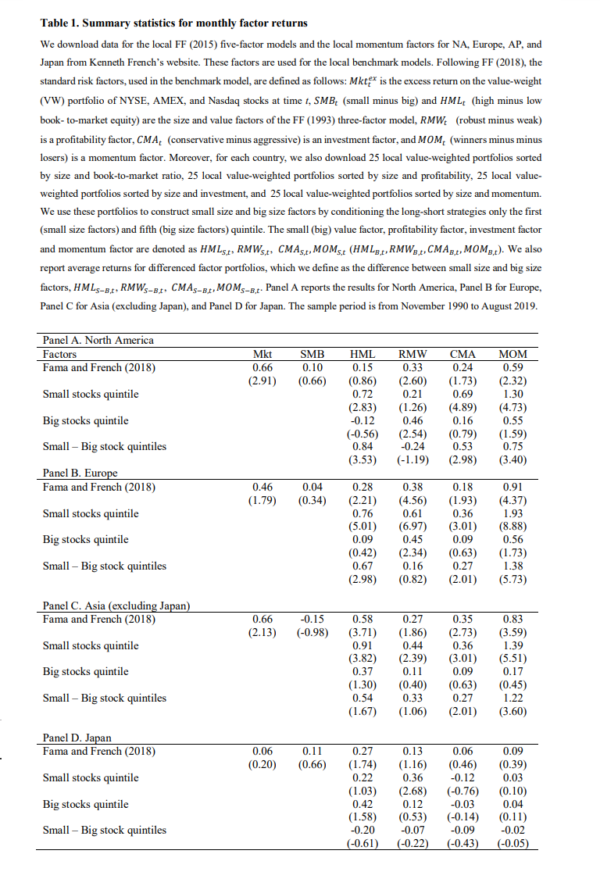
Klaus Grobys contributes to the literature on asset pricing models with his October 2019 paper, “Another Look on Choosing Factors: The International Evidence.” Using bootstrap simulations, Grobys examined international markets, specifically the four regions of North America (NA), Europe, Japan and Asia Pacific (AP), as out-of-sample tests of the performance of the leading factors and asset pricing models. Considered were the Fama-French six factors of market beta, size, value, momentum, investment and profitability. He also specifically examined the performance of small stock and large stock spreads for the value, momentum, investment and profitability factors. The models studied were the capital asset pricing model, the 1993 Fama-French three-factor model (adding size and value), the 2015 Fama-French five-factor model (adding investment and profitability) and the 2018 six-factor Fama-French model (adding momentum).
Grobys’ data sample divided each factor into quintiles and covered the period November 1990 (when data for momentum is available) through August 2019. Widening the spread (from traditional measures for size as top and bottom 50 percent, and for the other factors as top and bottom 30 percent) should offer a higher contrast between risk factors based on different size groups of stocks.
The following is a summary of his findings:
- Confirming Fama and French’s findings from their 2018 study “Choosing Factors,” published in the May 2018 issue of the Journal of Financial Economics, small stock spread factors performed remarkably well (the premiums are bigger in small stocks than in large stocks). For example, in the U.S. the value premium in small stocks was 84 basis points (bps) .

- Consistent with prior research, the size factor is not statistically significant. However, Cliff Asness, Andrea Frazzini, Ronen Israel, Tobias Moskowitz and Lasse Pedersen, authors of the January 2015 paper “Size Matters, If You Control Your Junk,” examined the problem of the disappearing size premium by controlling for the quality factor (QMJ, quality minus junk) and found that “stocks with very poor quality (i.e., ‘junk’) are typically very small, have low average returns, and are typically distressed and illiquid securities.(1) These characteristics drive the strong negative relation between size and quality and the returns of these junk stocks chiefly explain the sporadic performance of the size premium and the challenges that have been hurled at it.” They also found: “Small quality stocks outperform large quality stocks and small junk stocks outperform large junk stocks, but the standard size effect suffers from a size-quality composition effect.” In other words, controlling for quality restores the size premium.
- In Europe, the premiums (other than size) for the factors were all positive and significant at least at the 5 percent confidence level and were greater in small stocks than in large in each case. The results were similar in Asia ex-Japan.
- Internationally, the value factor was statistically significant, positive and pervasive. In addition, it is not redundant in other models. However, the investment premium was not significant, and it is redundant in other models except in the U.S.
- Across all countries (ex-Japan), the profitability factor plays an important role in pricing stocks.
- The standard momentum (MOM) factor produced the highest premium (59 bps per month, with a t-stat of 2.3) of long/short portfolios in NA, Europe, and AP. “The evidence suggests that MOM plays a larger role in empirical asset than earlier recognized.”
- In Japan, while each of the factors produced positive premiums, none were statistically significant—the highest t-stat was for the value premium, at 1.74. However, they might be considered economically significant. The per-month premiums were market (6 bps), size (11 bps), value (27 bps), profitability (13 bps), investment (6 bps) and momentum (9 bps). In addition, the value factor when implemented among small stocks produced 36 bps per month with a t-statistic of 2.7, indicating statistical significance at the standard 5 percent level.
Conclusion
Grobys concluded:
“The six-factor model that combines the market factor and size factor with the small stock spread factors for value, profitability, investment and momentum, produces the highest maximum squared Sharpe ratio in most economies.” Klaus Grobys, Another Look on Choosing Factors: The International Evidence, Oct. 2019
The finding that factors have stronger performance in small stocks is consistent with the findings of the 2019 study “Fama and French Meet Datastream: Size, Value, Profitability, and Investment Factors in International Stock Returns.” The study covered NA, Europe, Japan and AP markets and the period December 1987 to March 2019. Using a data set from Datastream (other studies typically use Bloomberg data), the authors, Nusret Cakici and Adam Zaremba, concluded: “Most factor returns are driven by the smallest firms.” These findings have important implications for investors constructing factor-based portfolios, suggesting they should consider concentrating their exposures in the small-cap universe.
References[+]
| ↑1 | Here is a background piece on size and the stock market. |
|---|
About the Author: Larry Swedroe
—
Important Disclosures
For informational and educational purposes only and should not be construed as specific investment, accounting, legal, or tax advice. Certain information is deemed to be reliable, but its accuracy and completeness cannot be guaranteed. Third party information may become outdated or otherwise superseded without notice. Neither the Securities and Exchange Commission (SEC) nor any other federal or state agency has approved, determined the accuracy, or confirmed the adequacy of this article.
The views and opinions expressed herein are those of the author and do not necessarily reflect the views of Alpha Architect, its affiliates or its employees. Our full disclosures are available here. Definitions of common statistics used in our analysis are available here (towards the bottom).
Join thousands of other readers and subscribe to our blog.

