Last week I summarized the 2019 factor performance for U.S. stocks. A natural follow-up question was the following–“what about International stocks?”
A great question.
So below I dig into the 2019 performance for International Factor Portfolios.(1)
Let’s dig into the results.
Factor Investing Data and Results
One needs to start with a universe. I defined the universe as the top 1,500 stocks on Market Capitalization within developed markets–mainly those companies within the EAFE countries. Comparing the annual return for the equal-weighted universe (22.37%) to the EFA ETF (~22.03%), one notes that the two universes are similar.(2)
The holdings are updated on quarter-end dates (e.g., 12/31/18, 3/31/19, 6/30/19, and 9/30/19), with the factors being calculated on the same dates. Once the holdings and factors are calculated, the holdings are then split into decile portfolios (as well as quintiles, terciles, and halves) and held for 3 months.(3) All portfolios, including the Universe and the Factor Deciles, are equal-weighted. No transaction costs or other fees are applied to any of the portfolios.
Within the portfolios, I examine a variety of common factors:
Factors Analyzed
- Value Investing Factors (5):
- Enterprise Multiple (EBIT/TEV)
- Book-to-Market (B/M)
- Earning’s Yield (Inverse of P/E)
- Cash-Flow to Price (CF/P)
- Sales to Price (S/P)
- Other Investing Factors (5):
- Momentum (12_2)(4)
- Size
- Beta
- ROA (Quality) — Return on Assets
- FS Score — Our 10-point Financial Strength Score (very similar to the Piotroski F-Score!).(5)
For all variables except Size and Beta, a higher value is considered “better” and thus the firms would be in higher deciles. All returns are total returns and include the reinvestment of distributions (e.g., dividends).
The Value Factor Results
First, let’s examine the results of the five “Value” factors I described above. Below are the annualized returns to the long/short portfolios for the five respective Value factors. The x-axis represents the 2019 compound annual growth rate (CAGR), with the y-axis representing (1) the different Value measures and (2) levels of concentration.
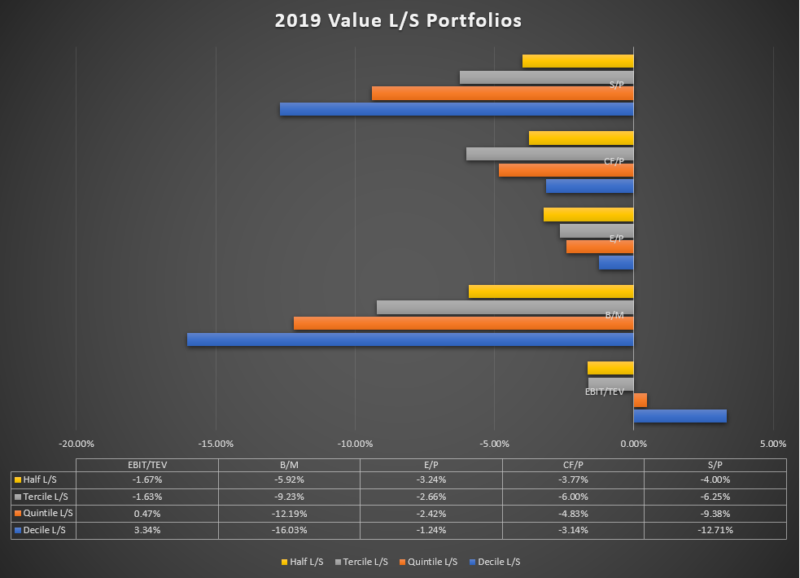
The results are hypothetical results and are NOT an indicator of future results and do NOT represent returns that any investor actually attained. Indexes are unmanaged, do not reflect management or trading fees, and one cannot invest directly in an index.
With the exception of a concentrated EBIT/TEV Value portfolio (6), most Value factors had negative performance in 2019. Hence, the ongoing (now multi-year) discussion of “is Value investing dead?”
Similar to my analysis within U.S. factors, I vary the levels of “concentration” to each Value factor. For example, the Decile performance is going to be long/short the top/bottom decile on each measure. Since our starting universe is 1,500 stocks, this means we are long 150 firms and short 150 firms. Compare this to the “halves” portfolio, whereby the portfolio is long the top half and short the bottom half–the portfolio is long 750 stocks and short 750 stocks.(7)
Examining the results above, one notices, not surprisingly, that when one makes a more concentrated bet to a factor that isn’t working well, the performance is even worse.
For example, the results to B/M are striking–the more concentrated one was to the B/M factor, the worse the performance. Below are the stats with varying levels of portfolio concentration:
- Half (least concentrated) = -5.92%
- Tercile (1/3s) = -9.23%
- Quintile (1/5s) = -12.19%
- Decile (most concentrated) = -16.03%
As seen above, a more “watered-down” approach would have been better in 2019, especially for B/M investors. These results are similar to the analysis I did in the middle of last year, examining Value investing and concentration.
However, most factor investors use long-only funds for their investment portfolios, as opposed to long/short funds.(8) So below I show the results to the “top” portfolio and the “bottom” portfolio on each Value measure while varying the concentration level.(9)
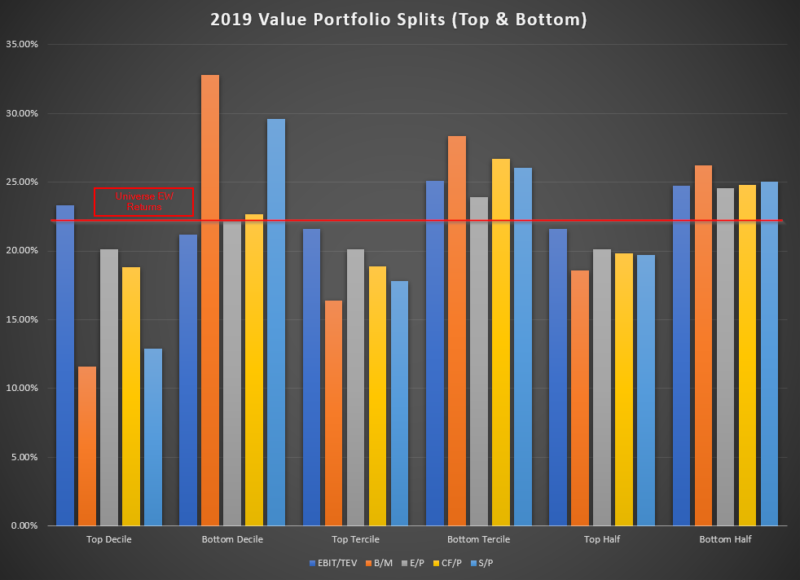
The results are hypothetical results and are NOT an indicator of future results and do NOT represent returns that any investor actually attained. Indexes are unmanaged, do not reflect management or trading fees, and one cannot invest directly in an index.
Here, the y-axis represents the compound annual growth rate (CAGR) for each portfolio, while the x-axis varies (1) the value measures and (2) the concentration level.
Maybe surprisingly, after viewing the long/short portfolio results above, all of the portfolios had a positive return in 2019!
What one notices is that the more concentrated “top” portfolios did significantly worse than the equal-weighted universe return, as well as compared to their corresponding “bottom” portfolios. As we move from left to right, we notice, not surprisingly, that as our portfolio becomes more and more like the market (i.e. picking the top 500 Value stocks as opposed to the top 100 Value stocks), the returns become closer to the market. (see here on closet indexing)
Thus, the results above highlight the effects of concentration within “value” portfolios.
So overall, within developed International stocks, Value had a bad year no matter how one picked cheap stocks. However, for long-only investors, at least it was a “positive” returning year.
But what about the other non-Value factors mentioned above? How did they perform?
Below I run a similar analysis on the other 5 factors: Momentum, Size, Beta, ROA, and FS-Score. Similar to the analysis above for Value portfolios, I vary the concentration levels for each factor.
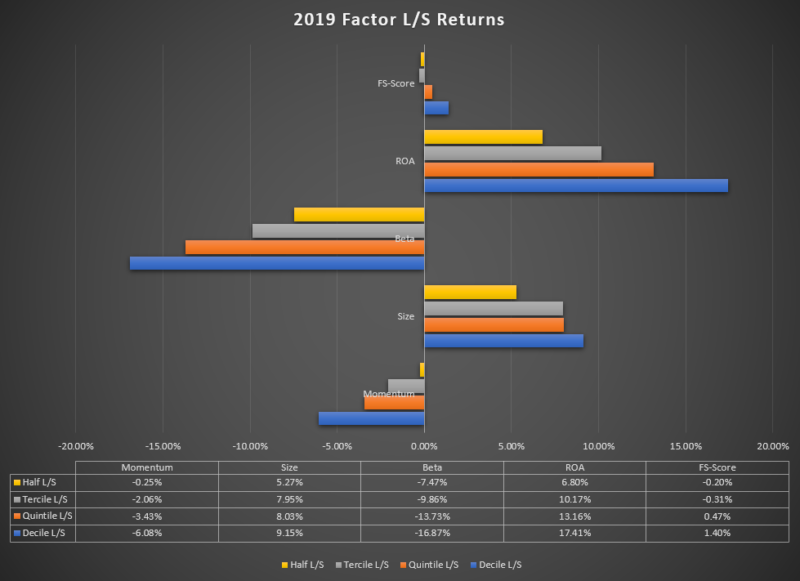
Here, we see more variation in the results. Some factors did well (ROA and Size) while some did poorly (Beta and Momentum).
In general, the concentration results are similar as shown above for Value–if the factor was not working, more concentration simply amplified the pain.
However, since most investors are invested in long-only funds, let’s examine the returns to the “good” and “bad” portfolios, in other words, the “long” and the “short” portfolios. So below I show the results to the “top” portfolio and the “bottom” portfolio on each Factor measure while varying the concentration level.(10)
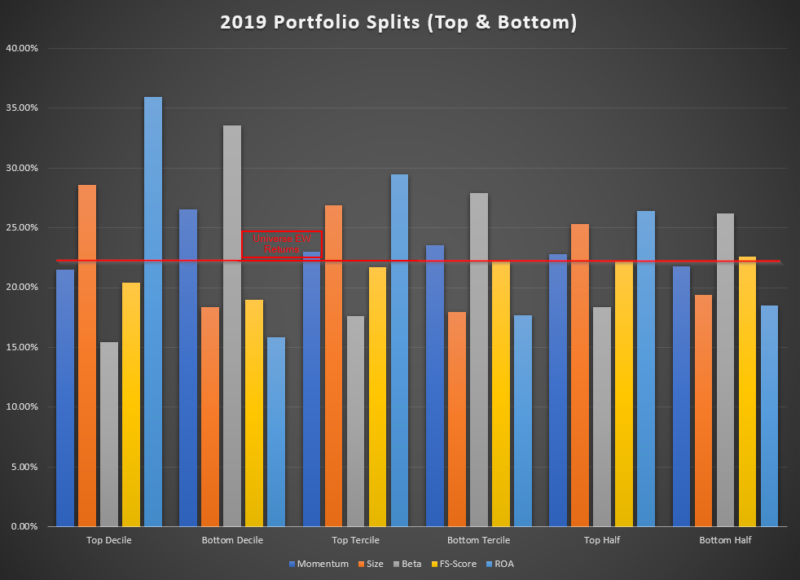
Once again, the long-only portfolios had a positive return in 2019. Similar to the results for the Value factors, the less concentrated the portfolios (i.e. the more the portfolio is similar to the market), the more the annualized returns converge to the universe CAGR.
Conclusion
Above we examined the 2019 Performance for International Factors. In 2019, most Value measures failed, while non-value factors had mixed performance. However, for long-only factor investors, at least 2019 was a positive year from a return standpoint.
When examining the effect that concentration has on factor returns, one finds that if a factor is not working, taking a more concentrated bet on that factor would have been painful.
It should be caveated that this is only examining stocks that were, at one point in time, amongst the 1,500 largest firms in developed international markets. In addition, managers and funds generally (1) hold more or fewer stocks, (2) use different weighting schemes, (3) use different rebalance dates, (4) combine or use multiple signals, and (5) may invest in stocks outside of this universe. Thus, this cannot fully explain all the returns to factor portfolios, but it is a start.
As a reminder, factor investing is a systematic and repeatable process that will tilt one’s portfolio towards stocks with certain characteristics or attributes. While there was evidence of certain “factors” working in the past, there is no guarantee of future performance, and it certainly will not work all the time, as we highlight here.
References[+]
| ↑1 | Avid readers of the blog may have found similar results under the “index tools” section of our site! On that page, we have standardized performance results for factor portfolios. The results in this article vary slightly as I rebalance these portfolios quarterly, as opposed to monthly on the index page. |
|---|---|
| ↑2 | Obviously, results would change if we changed the starting universe. |
| ↑3 | All data and calculations are done by FactSet. Fundamental data is lagged 6 months to avoid a “look-ahead” bias. |
| ↑4 | The twelve-month total return excluding the prior month. |
| ↑5 | The FS-Score variable also has EBIT/TEV/100 added to its FS-Score value in order to break any “ties”. |
| ↑6 | A discussion on the topic is here if you are unfamiliar with this ratio. |
| ↑7 | It should be noted, that if a firm does not have a value for a factor, it is not included in any portfolios. |
| ↑8 | To be clear, the results above are the returns to long/short portfolios! |
| ↑9 | For ease of exposition, I have excluded the quintile results. |
| ↑10 | Similar to Value, I have excluded the quintile results in order to make the results easier to read. |
About the Author: Jack Vogel, PhD
—
Important Disclosures
For informational and educational purposes only and should not be construed as specific investment, accounting, legal, or tax advice. Certain information is deemed to be reliable, but its accuracy and completeness cannot be guaranteed. Third party information may become outdated or otherwise superseded without notice. Neither the Securities and Exchange Commission (SEC) nor any other federal or state agency has approved, determined the accuracy, or confirmed the adequacy of this article.
The views and opinions expressed herein are those of the author and do not necessarily reflect the views of Alpha Architect, its affiliates or its employees. Our full disclosures are available here. Definitions of common statistics used in our analysis are available here (towards the bottom).
Join thousands of other readers and subscribe to our blog.