The promise of active investing is compelling: the opportunity to earn higher risk-adjusted returns! And paying a fee to an active manager–who is doing something unique–can make sense. And as we know, the only way to beat a benchmark is by being different from the benchmark, as we discuss here.
It follows that if a fund has a large fraction of holdings that are different from its benchmark, it becomes more likely that the fund will be able to outperform (or underperform) the benchmark, gross of fees. Intuitively, in order to outperform, one must be different (Pat O’Shaughnessy also has a good piece here). Howard Marks says it best in his piece “Dare to be Great:”
This just in: you can’t take the same actions as everyone else and expect to outperform.
But what if 50% of the portfolio of a so-called “active” fund actually holds positions that are identical to those found in an index fund tracking the S&P 500? What about if these passive positions made up 75% of the “active” fund’s portfolio? Well, that would not really be active or different at all, right? This would be much closer to pure passive, index-based investing, which can be done at low cost. In cases like these, we probably should not be willing to pay more expensive, active fees, since we are not receiving “active” stock selection services. Sadly, however, many do pay high fees for mostly passive exposures.
Welcome to the world of “closet indexing,” where funds hold many of the same securities as their passive benchmarks, but investors still pay full freight for what they think is “active” management.
In a recent paper, “Do Mutual Fund Investors Get What They Pay For? The Legal Consequences of Closet Index Funds,” by Cremers and Curtis, the authors investigate the evidence for closet indexing and how closet indexing affects investors.
Before getting into the details of the paper, it’s useful to discuss the concept of Active Share, which can help us understand the closet indexing phenomenon.
What is Active Share?
Active Share measures how different a fund’s holdings are from the fund’s benchmark. How does this work in practice? We provide an example below, from the paper, to demonstrate the measurement mechanics.
Consider a hypothetical active fund (column 1) that invests in 4 stocks, while the fund’s benchmark invests in 5 stocks, in different weights, as per the chart below:
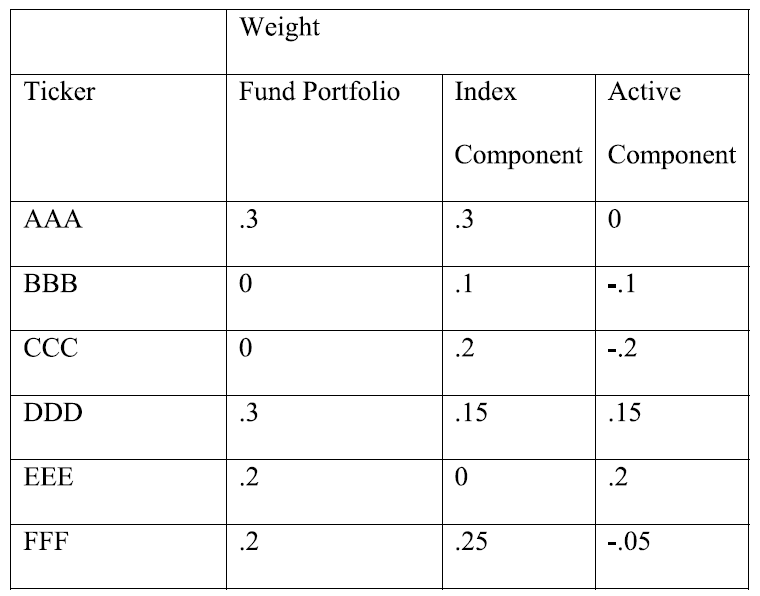
Note that there are two dimensions of difference between the fund holdings and the benchmark holdings:
- The overlap of stocks in the fund and the benchmark: Of the fund’s 4 stock portfolio, 3 are also in the benchmark (AAA, DDD, and FFF), and 1 is not in the benchmark (EEE), while the benchmark contains 2 stocks that the fund does not hold (BBB and CCC).
- The weights of stocks in both the fund and the benchmark: We can see that the weights of stocks held in the fund that are also in the benchmark sometimes differ; for instance the fund holds 25% less of FFF than the benchmark does, but twice as much DDD.
These two dimensions combine to describe how different a fund is from the benchmark. We can quantify these dimensions using Active Share, which is the sum of the absolute value of these active positions divided by 2:
(0+0.1+0.2+0.15+0.2+0.05)/2 = 0.7/2 = 35%
Active Share represents the degree to which the fund is invested in 1) an Active component of 35%, which is different from the index, and 2) a Passive component of 65%, which owns the same stocks in the same weights as the index.
An investor could recreate the fund exposure by 1) going long/short the stocks related to the Active component, and 2) buying the index for the Passive component. We explored here how this is a useful framework for thinking about smart beta, which we argue is often a redundant and overpriced way to exploit investment factors.
Active Share is an interesting idea, but it is not immune from controversy. For instance, we wrote here and here about some disagreements between AQR and authors of the original Active Share paper. Readers can come to their own conclusions. Marijn Cremers maintains a website the provides active share for many funds here.
Why is Active Share Important for Investors?
Active Share is undoubtedly a useful concept for investors to understand (visual active share will be even better).
In our example above, the fund (which we’ll call Fund A) is effectively investing 65% of its investors’ money in the same positions as its benchmark index. The Active component is only 35%. Let’s say another fund, Fund B, is more active, with an Active Share of 70%.
What are the prospects for outperformance by each of these two funds? In short, they are quite different. Fund A would need to generate double the return on the active component of its portfolio to match the returns of Fund B on its managed assets. Obviously, this is very hard for Fund A to achieve. And in the real world, it turns out that closet indexers often simply fail to outperform.
Let’s try and make this more concrete: Consider a smart-beta value ETF that charges 0.50% and holds 250 value stocks and “smarter-beta” ETF that charges 1% and holds 50 value stocks. For simplicity, let’s assume the smart beta and the active ETFs follow the same strategy and that value strategies have similar systematic risk to the broad market. Which value ETF should we buy?
The naïve answer is “buy the cheapest,” but that answer is incorrect. The smart-beta ETF and the smarter-beta active ETF have very different return profiles and fees. As the authors highlight, investors need to look at both fees and expected returns to make the right call. For example, if the 50-stock value portfolio generates a 1.5% average expected return above the market (0.50% after fees), and a 250-stock value portfolio generates a 0.5% average expected return above the market (0.00% after fees), the smarter-beta ETF is a much better value despite being twice the cost. (See Wes’s WSJ article).
The Poster Child for Closet Indexing: The Magellan Fund
The Fidelity Magellan Fund became famous based on Peter Lynch’s strong management in the 80s. What is less well known is that even as the fund became the largest in the U.S., with $103 billion under management in 2001, its Active Share plunged during this time. (sidenote: we’ve also heard from a credible source that the fund was launched as a spaghetti against the wall fund).
The Chart below plots on the left axis the Active Share under a series of portfolio managers who ran the fund:
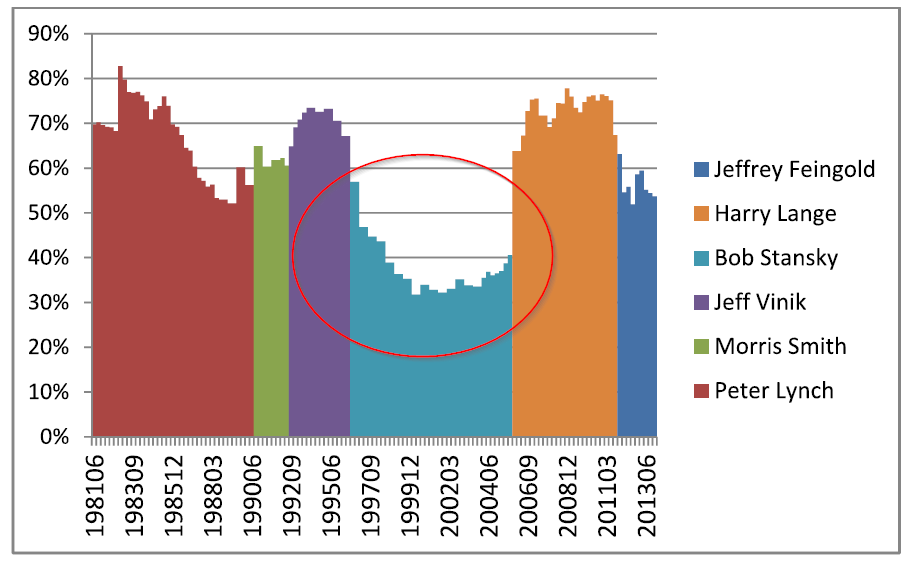
Note that during much of the time that Robert Stansky managed the fund, Magellan’s Active Share fell to the 30%-40% range. How did Magellan do during this time? Perhaps unsurprisingly, performance over the period was very close to the benchmark — minus 1% per year for management fees, of course — as is further discussed in this article.
A quote from the paper says it all:
During the Stansky years…regardless of the direction the market went, Magellan investors were likely to do poorly relative to the benchmark, because they were – in effect – buying the benchmark at high cost. For example, while the expense ratio was only 0.75%, the Active Fee or how much investors of the Fidelity Magellan fund were actually paying for active management at the end of 2001 amounted to 1.95% per year.
What does the evidence say regarding closet indexers?
How prevalent are closet indexing funds?
The authors use data from 2014 from the Thompson-Reuters mutual fund holdings database, and examine funds that invest at least 80% of their assets in U.S. equities, and calculate Active share versus the self-declared benchmark. The sample includes 1,225 U.S. mutual funds managing $2.7 trillion. The authors use 60% Active Share as a cutoff for closet indexing; that is, if a fund has Active Share < 60% it is considered a closet indexer.
Below are the summary statistics for Active Share for 2014:

Two things that are striking about these results are the following:
- Closet indexing is more common than you might expect overall
- Closet indexing is primarily a Large Cap Fund phenomenon.
How Does Closet Indexing Impact Fund Performance?
By now, it should be clear that closet indexing is a real phenomenon, and has at least the potential to reduce returns to mutual fund investors. But what actually happens to returns in the real world, in the aggregate?
The authors focus on the large cap funds identified above, and track the performance of 25 different mutual fund portfolios by sorting the funds along two dimensions:
- Expense Ratio: construct five quintile portfolios (1 through 5 on the vertical axis) based on the expense ratio of the funds. The average annual expense ratios are 1) 0.58%, 2) 0.96%, 3) 1.16%, 4) 1.38%, and 5) 1.80%.
- Active Share: construct five quintile portfolios (1 through 5 on the horizontal axis) based on Active Share
These two sorts create 5X5=25 different portfolios. The table below presents summary statistics for the period 1989-2014, and shows abnormal return, or alpha, for each large cap fund portfolio over the time period, after controlling for exposure to Fama-French factors (market, size, value and momentum):
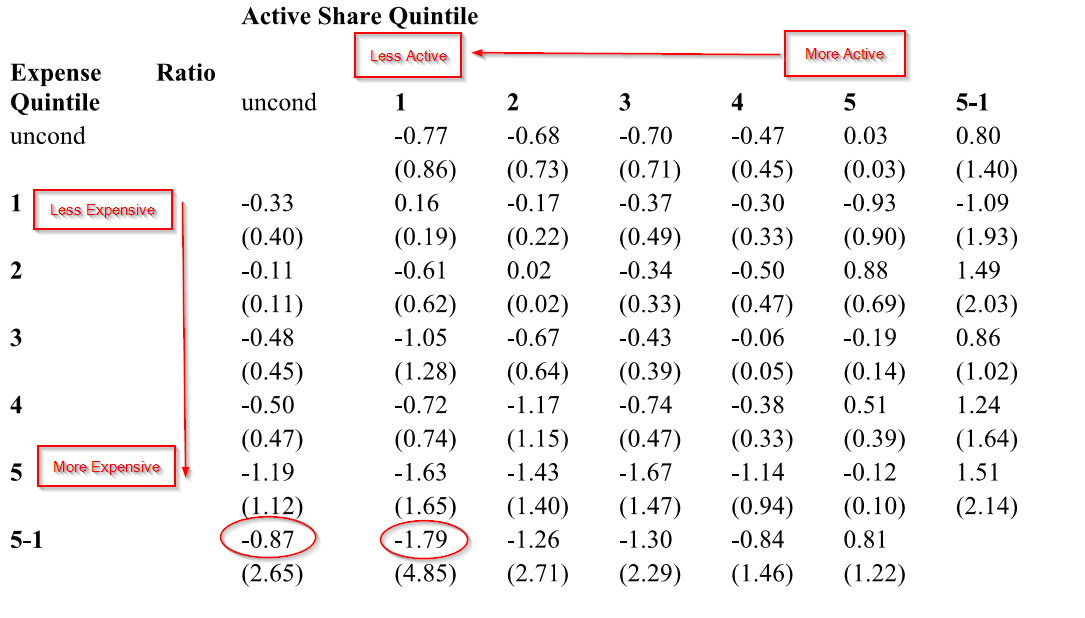
The results are hypothetical results and are NOT an indicator of future results and do NOT represent returns that any investor actually attained. Indexes are unmanaged, do not reflect management or trading fees, and one cannot invest directly in an index. Additional information regarding the construction of these results is available upon request.
What do you notice? First, on the single sort by expense ratio (the “uncond” column), the abnormal spread between most expensive and least expensive quintiles is -0.87% per year, with a t-statistic of 2.65, which is significant at the 1% level. Fees matter. Check. Second, the spread in performance increases to -1.79% for funds in the lowest Active Share quintile, with a t-statistic of 4.85. Interestingly enough, controlling for level of activity/uniqueness, there isn’t a strong relationship between performance and fees.
Lesson learned: avoid expensive closet index funds (hint: many smart beta funds are closet index funds, by construction. So watch the fees!).
Active Fee: Adjusting Active Expense Ratios to Account for Passive Exposures
So how much are you really paying for the active component of a strategy? It is a straightforward matter to back out the fee per unit of active management. The authors present “Active Fee,” which uses the following formula (where “Index Fund Fee” is the expense ratio associated the benchmark):
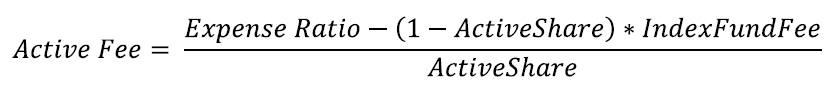
The formula involves three muscle movements: 1) active share, 2) the expense ratio, and 3) the index expense ratio. We explain each below:
- Expense Ratio: The expense ratio associated with the active fund.
- Index Expense Ratio: The expense ratio associated with the costs of investing in the active fund’s index benchmark.
- Active Share: The “active share” element of active fee is a bit more complicated, mildly controversial, but fairly intuitive. Active share simply measures how different a fund’s holdings are from its benchmark and helps an investor determine what percentage of a fund is unique, or active, and what percentage of a fund is not differentiated, or passive.
With the three ingredients in hand, let’s make active fee a bit more tangible. Consider an example with a 300 stock dividend yield fund (“Diluted Fund”) charging 0.50% and a 50 stock dividend yield fund (“Concentrated Fund”) charging 1.00%. Assume the ActiveShare on the Diluted Fund is 30% (i.e., 30% active, 70% passive) and the ActiveShare on the Concentrated Fund is 90% (i.e., 90% active, 10% passive). Let’s also assume there is a low-cost passive index fund that serves as an appropriate benchmark for the two dividend yield funds. The cost of this passive fund is 0.25%.
If we plug in the numbers from our hypothetical example we get the following results:
- Diluted Fund ActiveFee = 1.08%
- Concentrated Fund ActiveFee = 1.08%
Remarkable. Even though the Concentrated Fund charges double the management fee, on an active fee basis, the fees are the same as the Diluted Fund. Why? When measured per unit of active investment delivered, the Concentrated Fund is providing more bang for the buck. Of course, different inputs could favor the Diluted Fund, and/or suggest that the cost of active management is simply too high and passive is the answer. Regardless, the example highlights why Active Fee is a needed evolution in manager selection and has the potential to improve investor decision making.
Now that we have this great tool, we were curious as to what is suggested investors are paying for the the Active component of mutual funds. In the chart below, we assume a 7 bp fee for the index, applied the quintile expense ratio breakpoints from the paper, and calculated Active Expense across a range of Active Share figures:
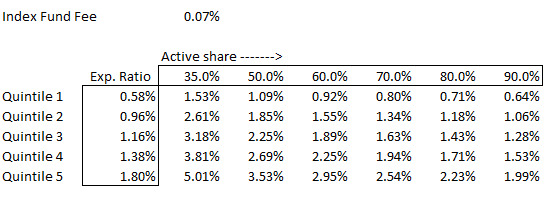
Crikey! If you own a low Active Share (35%) fund in Quintile 5, the active fund holdings must outperform by 5% per year before you receive any performance benefits over the index. With any large cap fund, this is going to be quite a challenge, to say the least. Here is the underlying spreadsheet if you want to play with the variables.
Bottom line: beware of low Active Share funds with high expense ratios.
More information can be found in our transparent active management category–the research vein is getting larger over time!
Do Mutual Fund Investors Get What They Pay For? The Legal Consequences of Closet Index Funds
- Cremers and Curtis
- A version of the paper can be found here.
- Want a summary of academic papers with alpha? Check out our Academic Research Recap Category.
Abstract:
Actively managed mutual funds sell the potential to beat the market by picking stocks that are expected to outperform passive benchmarks like the S&P 500. Funds that are marketed as active vary substantially in the degree to which their portfolio holdings actually differ from the holdings of passive index funds. A purportedly active fund with a portfolio that substantially overlaps with the market is known as a closet index fund. Since closet index funds charge considerably higher fees than true index funds but provide a substantially similar portfolio, they tend to be poor investment choices. This article presents empirical evidence on closet index funds, showing that more than 10% of U.S. mutual fund assets are currently invested in closet index funds and that high cost closet index funds substantially underperform their benchmarks. We argue that persistent closet indexing implicates a number of legal issues, including possible liability for fund advisors under the Securities Act and the Investment Company Act. We conclude by discussing potential adjustments to mutual fund disclosures that could help investors identify closet index funds.
About the Author: David Foulke
—
Important Disclosures
For informational and educational purposes only and should not be construed as specific investment, accounting, legal, or tax advice. Certain information is deemed to be reliable, but its accuracy and completeness cannot be guaranteed. Third party information may become outdated or otherwise superseded without notice. Neither the Securities and Exchange Commission (SEC) nor any other federal or state agency has approved, determined the accuracy, or confirmed the adequacy of this article.
The views and opinions expressed herein are those of the author and do not necessarily reflect the views of Alpha Architect, its affiliates or its employees. Our full disclosures are available here. Definitions of common statistics used in our analysis are available here (towards the bottom).
Join thousands of other readers and subscribe to our blog.