A common question we receive at Alpha Architect is the following: “Why do you focus on EBIT/TEV as a value screen for stocks instead of the more traditional measures such as book to price?”
In short, we believe stocks are ownerships in businesses (I know that sounds crazy coming from a quant shop!). As systematic business buyers, we want a valuation metric (or set of metrics) that, 1) make economic sense and 2) facilitates comparisons across a broad swath of firms in the stock market. EBIT/TEV is that metric, in our opinion.
From our quantitative value piece:
“As Benjamin Graham, the intellectual founder of the value investment philosophy, states in his classic text, The Intelligent Investor, “Investment is most intelligent when it is most businesslike.”
Let’s start with some basic information behind the mechanics of EBIT/TEV.(1)
EBIT (Earnings Before Interest & Taxes)
EBIT stands for Earnings Before Interest and Taxes and is commonly referred to as “operating income”.(2) EBIT is a great way to gain a clear grasp on the economic profitability of a firm, without all the baggage associated with other valuation metrics. EBITDA is a close cousin that adds back depreciation and amortization, but EBIT is our preferred metric because it captures the economic reality that different firms have different capital expenditure needs. Depreciation and amortization, while far from perfect, are a reasonable way to account for run-rate capex costs.(3)
The basic breakdown for EBIT is as follows:
Revenues – Cost of Goods sold (COGS) – Selling/General/Administrative (SGA) = EBIT = Operating Income
Let’s say I run a donut shop:
- My revenue is my donut sales.
- $100k/yr
- My COGS are the ingredients for the donuts and the labor required to produce the donuts.
- $65k/yr
- My SGA is my rent and bills to keep things running (and maybe a depreciation charge to account for the fact I have to replace my oven every 10 years).
- $20k/yr
- What I’m left with is my operating income, or EBIT.
- $15k/yr
EBIT captures the profitability of a business, regardless if it is Google, Macy’s, Netflix, or the donut shop.(4) In contrast, some measures like book/market may not capture the value of an IP-driven firm like Google. EBIT doesn’t have that problem — operating income is a transparent way to understand what the assets of a firm can generate, regardless of how they are financed or if they are real assets (e.g., a factory) or intangible assets (e.g., human capital).
What about the interest expense and the taxes (i.e., the “I” and the “T” in EBIT)? Well, interest expense will depend on how I finance my donut shop. If I borrow a bunch of money from my rich uncle, my interest expense will be high; if I bootstrap the business by liquidating my life savings, my interest expense will be zero. How about taxes? Well, my taxes will also depend a lot on my idiosyncratic situation — how am I structured? Do I have NOLs? Do I have offshore entities? Did I take the loan from my uncle, which means I can now deduct the interest payments? And so forth.
Long story short, the further you move down the income statement , we enter a world that can get confusing very quickly and our ability to understand the economic profitability of a firm gets less and less transparent.
Total Enterprise Value
What is TEV?
Total Enterprise Value (TEV), or equivalently — Enterprise Value (EV) — is a way to measure the market value of all the claimants on a company (i.e., not just the equity value. Bondholders are people too!). In short, if I want to own the operating income of a firm, how much do I have to pay to have full rights on that income? TEV is a bit different than plain vanilla equity, which is simply the value of a company’s stock (if there is no debt, TEV ~ Market Cap). TEV takes into account the value of other firm claimants — primarily debt obligations and preferred/minority stockholders. But there is another wrinkle — the cash on the balance sheet. If we’re buying a business, once we pay off all claimants — we own everything…to include the cash in the bank account! Which in turn implies we can withdraw that cash and put it back in our pocket (or pay off the existing debt holders), thus lowering the overall cost of acquiring full rights to the firms operating income.
In the end, we’re left with the following equation for TEV:
Total Enterprise Value = market value of equity + market value of Debt + market value of other claimants (e.g., minority interest, preferred equity, pension liabilities, leases, and so forth) – excess cash.
A “Cap-Rate” for Stocks: EBIT/TEV
Combine a company’s operating income (EBIT) and its price (TEV) and now we can understand how much we have to pay to acquire the operating income of a firm. We can think of this as an “EBIT Yield” or an “Operating Income Yield”, or if you are a real estate investor, a “Cap-rate.” All of these concepts address the same question — What am I making on my investment?
Let’s work through our donut shop example above. Pretend that we funded the donut shop with $100k equity and we borrowed $100k from our rich uncle. We also have $50k in the donut shop’s checking account. A friendly private equity investor shows up to the shop and says, “Hey, I’d like to purchase this business at a 10% operating income yield.” (Or think of this as a “10% cap-rate” if you are a real estate person).
We tell the business buyer that we think a 10% yield is a fair value and we propose a $150k enterprise value ($100k equity + $100k debt – $50k cash).
We propose the following transactions:
- The private equity buyer pays off my rich uncle’s debt of $100k (but takes the $50k cash and puts it back in his pocket for a net cost of $50k).
- The private equity buyer then pays off the equity for $100k
- The private equity buyer now owns 100% of the rights to the $15k in operating income and pays a net cost of $150k, implying an operating income yield of 10% ($15k of operating income for $150k of costs).
Everyone is happy. And EBIT/TEV, the business buyer metric, has once again achieved the goal of helping buyers/sellers make an informed transaction decision without having to go down the rabbit hole of mental gymnastics trying to compare businesses with different capital structures and tax situations.
With the definitions out of the way, let’s get back to the main question: Why would a systematic value investor want to focus on a transactional business buyer metric like EBIT/TEV versus the more common systematic value metrics like book/market? That’s easy — we’re systematic business buyers; we’re not quants.
Let’s dig a bit deeper.
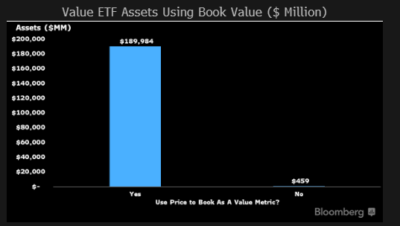
A Quick Fact: Almost All Value ETFs use Book Value
This image from Bloomberg analyst Athanasios Psarofagis shows the large majority of value ETFs use B/P as one of (or their only) value screen.
What’s the problem with using Book to Price as your value screen? Here’s Reshma Kapadia from Barron’s:
“But there’s a problem with price/book: today’s economy. Price/book, perhaps the most conventional measure of value, evaluates stock prices based on a company’s book value—the worth of all tangible assets but no intangible ones. Price/book and similar accounting-based metrics worked better in an industrial-based economy, when companies owned valuable tangible assets, like manufacturing plants and equipment. Today’s service economy is filled with companies whose biggest assets are their brands, intellectual property, or customer loyalty, which don’t show up on the balance sheet.
EBIT/TEV doesn’t suffer the fate of book/price. For example, Apple owns a ton of intangible assets, but very few assets with book value, however, they generate massive earnings and hold an enormous cash horde. Book/price will scream expensive; even earnings/price will scream expensive because it won’t account for the huge cash pile that Apple keeps. Only EBIT/TEV will provide a relatively accurate valuation assessment from the perspective of a business buyer. Is EBIT/TEV perfect? Of course not. Is book/price a complete failure? Of course not. But in the end, we believe that relying on a metric like EBIT/TEV, which seems to capture economic reality more accurately, is a reasonable approach.
Who Cares? All These Value Strategies End Up Owning the Same Thing Anyway, Right?
When it comes to value funds, many investors assume they are effectively the same thing — a commodity in the marketplace. Turns out that is decidedly not the case.
We explained in the opening why we believe EBIT/TEV is a reasonable business buyer metric. Let’s look at the situation via our visual active share tool.
First, a quick orientation to the charts below. The tool below shows stocks in the S&P 500 (as represented by the ETF SPY) sorted by Book/Price and percentile ranked from 0 (expensive) to 100 (cheapest). The more undervalued the stock is, the further to the right it is. The stocks far to the right are the ones a value screen leveraging Book to Price would own (in this hypothetical example). The Y-axis represents the size, or market cap. The bigger the stock is in terms of market cap, the higher up Y-axis it will appear. Finally, the size of each circle reflects the weight in the S&P 500. For this quick exercise, we’ll focus on the biggest stocks, as they’re the household names that make this exercise more tangible.
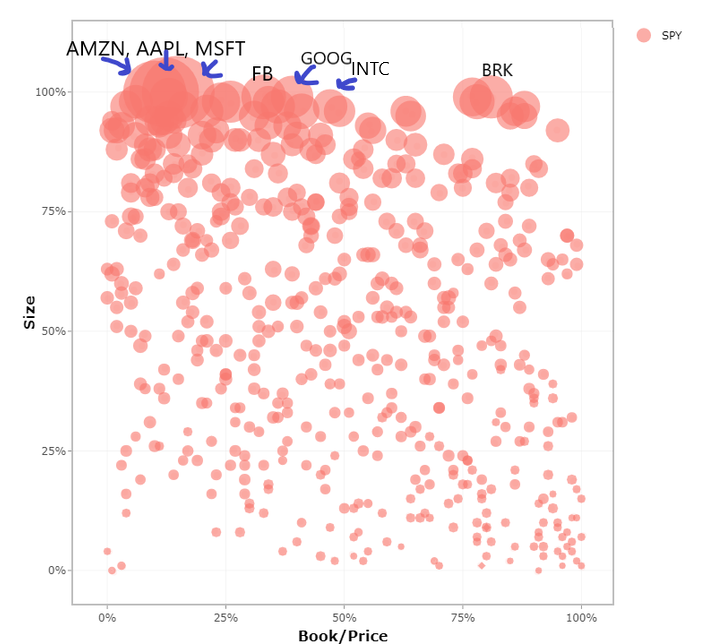
Three things to notice:
- The big tech stocks all range from expensive to extremely expensive (all the way to the left) as measured by book to price.
- Berkshire Hathaway (BRK), as would be suspected, is cheap based on fundamentals (in the top 25% most undervalued stocks by B/Price).
- Intel Corporation (some would deem an “older” tech company) falls in the middle based on its Book to Price
What about the same chart using EBIT/TEV?
The stocks that are further to the right (the ones more likely to be owned by an investment strategy that uses EBIT/TEV) have changed.
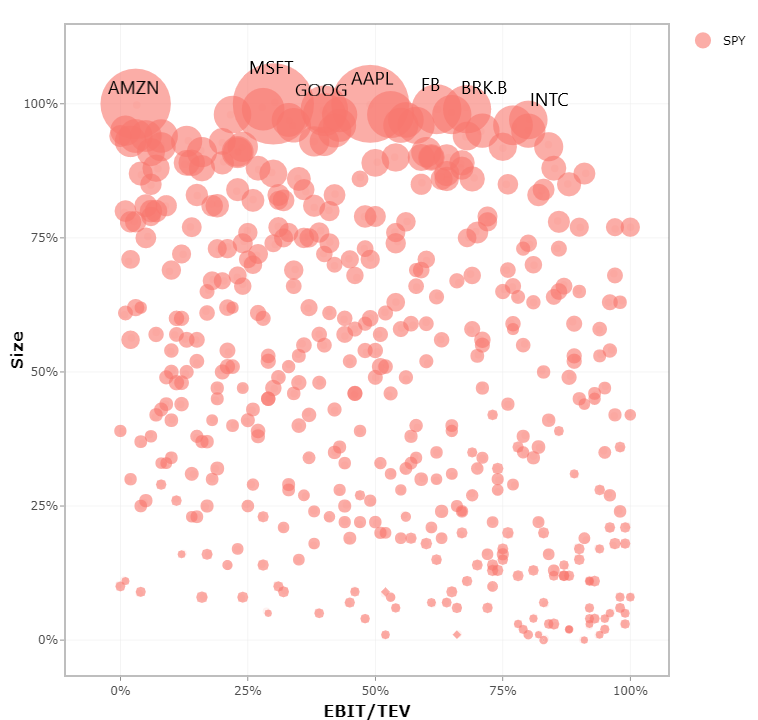
Three things to notice when sorted by EBIT/TEV:
- The mega-cap tech stocks are no longer uniformly expensive. Depending on how concentrated your screen is, you may even own some of them in a value portfolio.
- Facebook is only slightly more expensive than Berkshire Hathway. Both are in the top 50% of undervalued companies (they’re on the right half of the image).
- Intel Corporation (INTC) moved from being an average valuation by Book/Price to being arguably the most undervalued of the mega-cap companies when viewed by EBIT/TEV.
Conclusion on EBIT/TEV
Which value screen is right? Neither and both. We believe in value investing because cheaper stocks have historically earned higher long-term returns regardless of the value screen selected. We believe in the persistence of value investing because for almost every data set for any asset class we can find value investing seems to have worked. We believe in EBIT/TEV over other value screens because we believe it is more intuitive and broadly applicable to investing in today’s economy.(5)(6) Also, systematic value investing doesn’t start and end on the valuation metric. We, like many others, can explore other characteristics of a firm (e.g., negative screens, fundamentals, operational momentum, etc.) to achieve our goal of finding the cheapest highest quality businesses, systematically.
References[+]
| ↑1 | Note. Our process involves many moving pieces to identify the cheapest, highest quality value stocks, however, the focus on this piece is the valuation metric. Also, Here is a good piece by Doug Pugliese on the heavy use of EBITDA in investment banking |
|---|---|
| ↑2 | Note that technically, non-operating income is included in EBIT, so there can be differences. We focus on operating income in our own analysis/calculations and use the terms interchangeably. |
| ↑3 | I realize this is a loaded statement and an army of fundamental value investors will slice and dice this into a thousand pieces, but let’s move on. |
| ↑4 | EBIT is not a panacea. For example, banks get tricky since interest revenue and interest costs drive the business. EBIT doesn’t make sense because interest expense are COGS for a bank. |
| ↑5 | This piece was inspired by Tom Greco at Concentus Wealth. Thanks Tom! |
| ↑6 | This is the simplified answer. If you want the geek answer, you can go read Wes’ book on the subject and/or a string of published academic papers on the subject of EBIT/TEV’s merits over other value screens here |
About the Author: Ryan Kirlin
—
Important Disclosures
For informational and educational purposes only and should not be construed as specific investment, accounting, legal, or tax advice. Certain information is deemed to be reliable, but its accuracy and completeness cannot be guaranteed. Third party information may become outdated or otherwise superseded without notice. Neither the Securities and Exchange Commission (SEC) nor any other federal or state agency has approved, determined the accuracy, or confirmed the adequacy of this article.
The views and opinions expressed herein are those of the author and do not necessarily reflect the views of Alpha Architect, its affiliates or its employees. Our full disclosures are available here. Definitions of common statistics used in our analysis are available here (towards the bottom).
Join thousands of other readers and subscribe to our blog.