We’ve saw a spike in questions the last few days related to the various “value is really cheap posts” coming into the mainstream. This conversation was elevated after Cliff Asness posted the best piece of the bunch in his “Is (Systematic) Value Investing Dead?“
This post also created a surge in spirited debate via twitter. (e.g., here).
Unfortunately, the twitter debate is causing confusion for those who are not 100% buried in the minutia and/or don’t have the context (twitter doesn’t help with the character limits!).
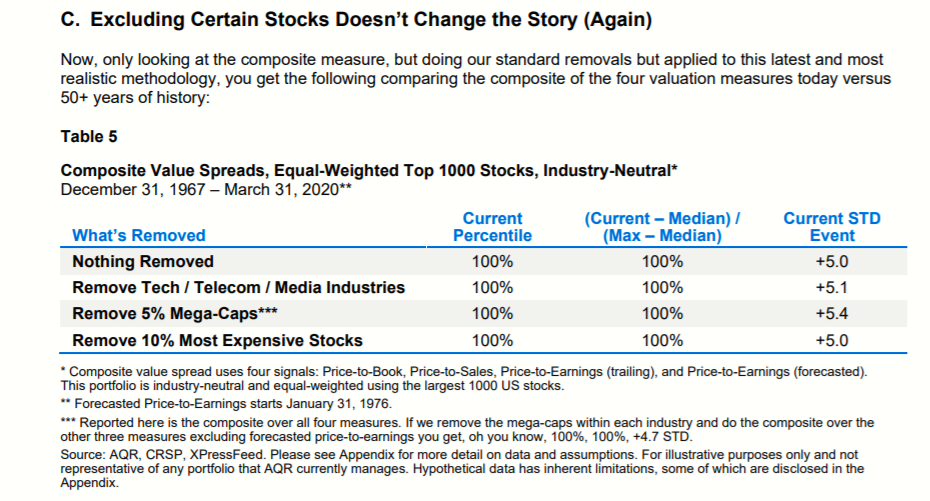
From an outsider’s perspective, it seems as if Asness is saying that the “value” of value portfolios is at extremes, while others are saying that the “value” of value portfolios is not at extremes.
How can those statements be true at the same time?
Answer: it depends on what you are measuring.
Value looks cheap on a relative basis, but doesn’t scream totally cheap on an absolute basis.(1)
Absolute value versus relative value
As we have discussed recently on the blog, when one looks at the “value” of value portfolios RELATIVE to the market (or portfolios of the most expensive stocks) — value looks really cheap.
Asness points this out from every angle imaginable and makes this point painfully clear/obvious.

Nobody can deny (based on the data) that the spread between value stocks and the market (or “growth”) stocks are at extreme levels.
But one can point out that on an absolute basis, value stocks don’t seem extreme cheap.(2)
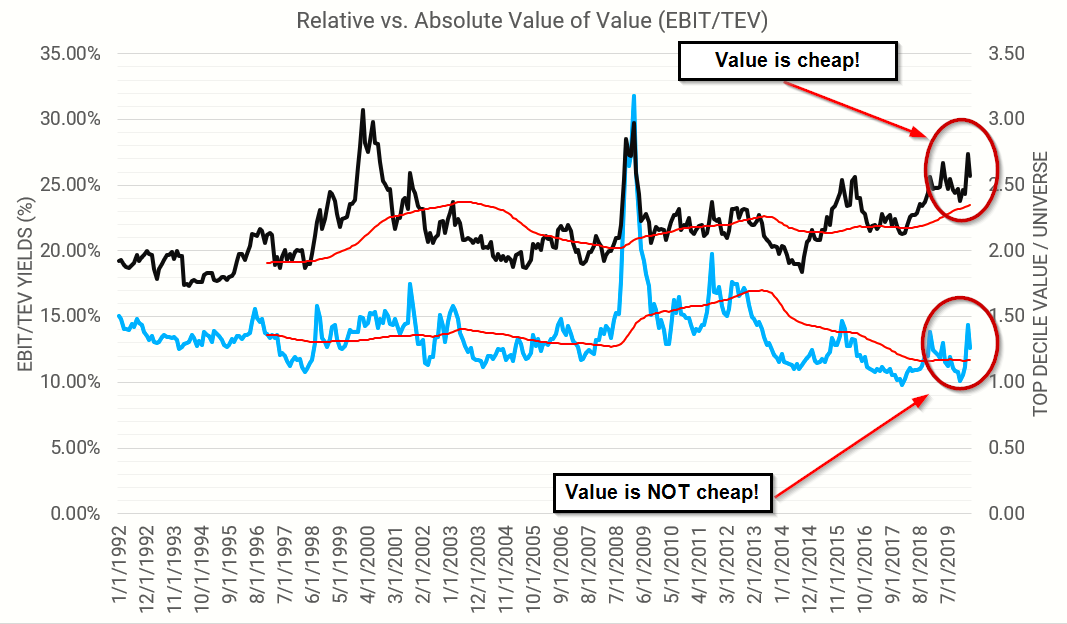
The chart below maps out the following from 1/1/1992 to 4/30/2020:
- Right-axis (black line): The ratio of the top decile value (based on EBIT/TEV) / US Universe. Higher => Relatively cheaper(3)
- Left-axis (blue line): The EBIT/TEV of the top decile value portfolio. Higher => Cheaper(4)
- We also plot the 5-year moving average to get a sense for the long-term dynamics
- The source for all of this is https://alphaarchitect.com/visualfactors/ (free site/data)

The results are hypothetical results and are NOT an indicator of future results and do NOT represent returns that any investor actually attained. Indexes are unmanaged and do not reflect management or trading fees, and one cannot invest directly in an index.
Bottom line?
- On a relative basis, value portfolios are really cheap
- On an absolute basis, value portfolios are pretty average
If you do this on other value metrics you find a general pattern: relative basis really cheap; absolute basis is less clear cut
Implications?
Not going there in this blog. This short piece is meant to clear up the confusion related to the debates on “the value of value” and is not meant to take a strong stance on what the results actually mean or say about the future. We’ll all need to pull out our crystal balls to determine what the future holds for value.
About the Author: Wesley Gray, PhD
—
Important Disclosures
For informational and educational purposes only and should not be construed as specific investment, accounting, legal, or tax advice. Certain information is deemed to be reliable, but its accuracy and completeness cannot be guaranteed. Third party information may become outdated or otherwise superseded without notice. Neither the Securities and Exchange Commission (SEC) nor any other federal or state agency has approved, determined the accuracy, or confirmed the adequacy of this article.
The views and opinions expressed herein are those of the author and do not necessarily reflect the views of Alpha Architect, its affiliates or its employees. Our full disclosures are available here. Definitions of common statistics used in our analysis are available here (towards the bottom).
Join thousands of other readers and subscribe to our blog.

