Financial economists have long known that volatility and returns are negatively correlated. Fischer Black documented this in his 1976 paper “Studies of Stock Price Volatility Changes.” This relationship results in the tendency to produce negative equity returns in times of high volatility. In addition, the research, including the 2017 study “Tail Risk Mitigation with Managed Volatility Strategies,” demonstrates that while past returns do not predict future returns, past volatility largely predicts future near-term volatility—volatility is persistent (it clusters). High (low) volatility over the recent past tends to be followed by high (low) volatility in the near future. Taken together, these findings have led to the development of strategies that scale volatility inversely to past realized volatility.
Research Findings
Research, such as the 2017 study “A Century of Evidence on Trend-Following Investing (summary), the 2018 study “The Impact of Volatility Targeting” (summary), and the 2019 studies “Volatility Expectations and Returns” (summary) and “Portfolio Management of Commodity Trading Advisors With Volatility Targeting,” has not only confirmed that risk assets exhibit a negative relationship between returns and volatility but has also found that in addition to reducing volatility, scaling reduces excess kurtosis (fatter tails than in normal distributions), cutting both tails, right (good tail) and left (bad tail). For portfolios of risk assets, Sharpe ratios (measures of risk-adjusted return) are higher with volatility scaling. Another key finding was that, since volatility often increases in periods of negative returns, targeting volatility causes positions to be reduced, which is the same direction one would expect from a time-series momentum (trend-following) strategy.
However, these findings are contrary to traditional financial theory and the intuition that the standard risk-return tradeoff should lead to underperformance of a portfolio that scales down exposure during volatile periods (lowering risk but increasing returns). The strategy has worked because volatility clusters and historically increased volatility have not been compensated by higher returns.
Latest Research
Dion Bongaerts, Xiaowei Kang, and Mathijs van Dijk contribute to the literature on targeting volatility with their July 2020 study “Conditional Volatility Targeting.” They assessed the performance and practical implementation of volatility targeting strategies in major equity markets and factors. For equity markets, their data sample covered the 10 largest markets that historically account for over 80 to 90 percent of market capitalization in global equities, and the period January 1972 to March 2019. For equity factors, they used data from Kenneth French’s website to construct (large cap versions of) the momentum (MOM) as well as the size (SMB), value (HML), profitability (RMW) and investment (CMA) factors. The data ranges from July 1963 to March 2019 for the U.S. factors and from November 1990 to March 2019 for Global, Global ex-U.S., Europe, Japan and Asia ex-Japan factors, based on availability.
Following is a summary of their findings:
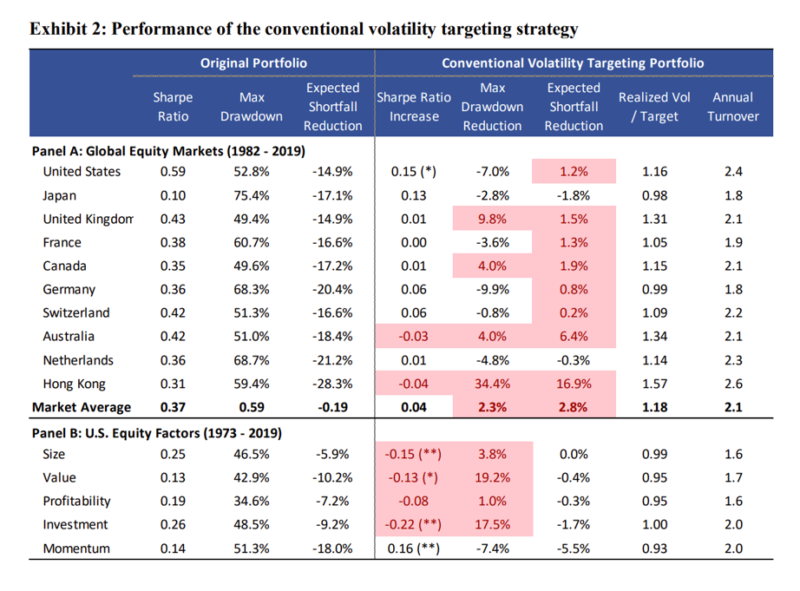
- While the conventional volatility targeting strategy improves results in the U.S. and Japan, it does not consistently improve risk-adjusted performance in international equity markets and can significantly overshoot the volatility target, thereby increasing maximum drawdowns and tail risks—it increased the maximum drawdown in the U.K., Canada, Australia, and Hong Kong by 4 to 34.4 percent.
- When applying the conventional strategy to equity factors, it increases Sharpe ratios for momentum across U.S. and international markets but not for the size, value, profitability, and investment factors (while increasing leverage and turnover costs).
- Conventional volatility targeting is associated with high portfolio turnover (often above 200 percent per annum) and significant time-varying leverage, which is likely to be problematic in practical implementations—casting doubt on its usefulness.
- Gains from volatility targeting vary with volatility states—during times of high volatility, volatility clustering is stronger, the correlation between realized volatility and future returns is significantly more negative, and the gains from volatility targeting are larger.
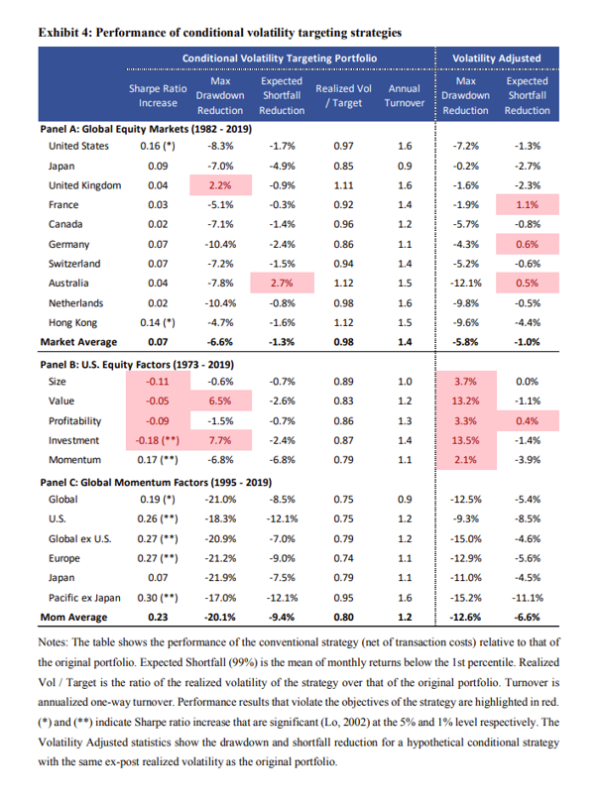
Motivated by these findings, Bongaerts, Kang, and van Dijk proposed a conditional volatility targeting strategy that adjusts risk exposures conditional on (extreme) volatility states—the strategy reduces risk exposures during high volatility states, increases risk exposures during low volatility states, and maintains an unscaled exposure otherwise. Specifically, if the volatility of month t – 1 was in the highest (lowest) quintile, they predicted a high (low) volatility state for month t; otherwise, they predicted a medium volatility state for month t. They capped the leverage in the low volatility states to prevent an increase in the overall risk and drawdowns (their strategy capped the maximum risk exposure at 200 percent but was robust to different levels of leverage). They found:
- The conditional strategy significantly reduces drawdowns and tails risks across all major equity markets and momentum factors, with significantly lower turnover than the conventional volatility targeting strategy.
- The conditional strategy enhances Sharpe ratios, most prominently for momentum factors across equity markets, and to a lesser degree for market factors.
- The annual turnover of the conditional strategy was much lower than that of the conventional strategy (e.g., 1.6 versus 2.4 for the U.S. market, and 1.4 versus 2.1 on average across markets).
- The performance of the conditional strategy is robust to alternative approaches to identifying volatility states.
- Dynamic allocation to treasury bond futures during periods of high equity volatility generates additional returns.
Their findings were consistent with those of Georg Cejnek and Florian Mair, authors of the 2020 study “Understanding Volatility-Managed Portfolios.” While they found that volatility management outperforms by levering up in good times without increasing downside exposure to fundamental risk drivers (regression results showed an upside beta of 1.3 and a downside beta of 0.8), they also found that while a simple linear regression showed no clear relationship between outperformance and volatility, once volatility exceeded a certain threshold, the volatility-managed portfolio always outperformed the unmanaged strategy. This threshold corresponded to an annualized realized volatility of about 68 percent. In all five of the most volatile months, the strategy outperformed the unmanaged index; in the most volatile month, October 2008, the outperformance was 13.8 percent.
Summary
Bongaerts, Kang, and van Dijk demonstrated that the benefits from volatility targeting are concentrated in high volatility states. In these states, volatility clustering is stronger, and the correlation between realized volatility and future return is significantly more negative. They also found that their conditional volatility targeting strategy significantly improves Sharpe ratios for momentum factors across regions, and to a lesser degree for market factors. The conditional strategy also consistently reduces maximum drawdowns and tail risks with much lower turnover and leverage than the conventional strategy.
They also demonstrated that conditional volatility management has broader applications, as it can be applied to tactical allocation between risky assets (equities, momentum factor) and flight-to-quality assets (treasuries, profitability factor), which further improves performance, particularly during high volatility states.
The research demonstrates that volatility management has produced a positive return asymmetry where positive returns are scaled up, except for very high returns occurring during reversals, while negative returns are scaled down. The most severe negative returns are especially scaled down, thereby increasing investor utility.
Disclosures
The contents of this article are for educational and informational purposes only and should not be construed as specific investment, accounting, legal, or tax advice. The analysis contained in this article may be based on third party information and may become outdated or otherwise superseded at any time without notice. Certain information contained in this article is based on third-party information and is deemed to be reliable, but its accuracy and completeness cannot be guaranteed. By clicking on any links above you acknowledge it solely at your convenience and do not necessarily imply any affiliation, endorsement, sponsorship whatsoever regarding us and third-party websites. We are not responsible for the content, availability, or privacy policies of these sites, and shall not be responsible or liable for any information, opinions, products, or advice on or available through them. The opinions expressed by featured authors are their own and may not accurately reflect those of Buckingham Strategic Wealth® / Buckingham Strategic Partners® (collectively Buckingham Wealth Partners). R-20-1327
About the Author: Larry Swedroe
—
Important Disclosures
For informational and educational purposes only and should not be construed as specific investment, accounting, legal, or tax advice. Certain information is deemed to be reliable, but its accuracy and completeness cannot be guaranteed. Third party information may become outdated or otherwise superseded without notice. Neither the Securities and Exchange Commission (SEC) nor any other federal or state agency has approved, determined the accuracy, or confirmed the adequacy of this article.
The views and opinions expressed herein are those of the author and do not necessarily reflect the views of Alpha Architect, its affiliates or its employees. Our full disclosures are available here. Definitions of common statistics used in our analysis are available here (towards the bottom).
Join thousands of other readers and subscribe to our blog.