The dramatic underperformance of value stocks as defined by the HmL (the return on high book-to-market stocks minus the return on low book-to-market stocks) since 2017 has led many to question the existence of the value premium. The recent drawdown has been by far the largest ever experienced. From January 2017 through August 2020, the Fama-French small value research index produced a total return of -13 percent versus the 71 percent total return of the Fama-French small growth research index. That performance has been so poor that it led to the disappearance of the value premium from a statistically significant standpoint for several decades. And that caused many to question its existence. In my July 30, 2020 article for Alpha Architect, “Is Systematic Value Dead” I addressed many of the issues raised against the value factor.
Particular concern has been raised about the exclusive use of HmL as the single metric defining value. What many investors are not aware of is that the first studies documenting that value was an anomaly for the single factor Capital Asset Pricing Model (CAPM) did not use HmL. For example, the 1983 study “The Relationship Between Earnings’ Yield, Market Value and Return for NYSE Common Stocks” by Sanjoy Basu used earnings yield as the measure determining value. Over the years, academic and practitioner studies have both used other metrics such as dividend yield, price-to-cash flow, price-to-sales, and enterprise value-to-EBITDA (earnings before interest, taxes, and depreciation) as measures of value. And all showed a value premium, demonstrating the robustness of the factor premium. HmL became the “workhorse” metric because it was the one Fama and French used in their famous three-factor model (beta, size and value). However, its singular use has been questioned by many. Even Dimensional (at which Fama and French served as heads of research) moved away from the single HmL metric in 2013 when they added profitability as a second valuation metric in their value fund construction methodology.
David Blitz and Matthias X. Hanauer contribute to the literature on the value premium with their October 2020 paper “Resurrecting the Value Premium.” They sought to show that the value premium could be restored through the use of a number of simple alterations that have been long used by many practitioners, as well as academics. They augment the book-to-market ratio with three alternative value signals, which have in common that instead of relying on balance sheet information, like book-to-market (or HmL) they are more based on earnings and cash-flows. In each case, they cite the sources of research supporting their usage. The three alternative metrics they used are:
- EBITDA/EV (enterprise value, the sum of claims by all claimants: creditors (secured and unsecured) and shareholders (preferred and common). They noted: “The EBITDA-to-EV ratio can be seen as an enhanced version of the classic earnings-to-price ratio, which is not affected by non-operating gains or losses, less susceptible to accounting leeway with depreciation and amortization, and also independent of the capital structure of the firm. Such enterprise multiples have also been popular among practitioners.”
- P/CF (price-to-cash flow). “By using information from the cash-flow statement of firms, this factor complements the B/M and EBITDA/EV metrics that are based on the balance sheet and income statement, respectively.”
- Net payout yield (NPY, the dividend yield, plus share buybacks, minus share issuance.). They noted that share buybacks and issuance are related to the asset growth that is used for the investment factors of Fama and French and the q-factor model of Hou, Xue, and Zhang.
Blitz and Hanauer then created:
“a composite value score by first normalizing each individual metric cross-sectionally using standard robust z-scores capped at +3 and -3, and then averaging these scores. Since two of our four value metrics, EBITDA/EV and CF/P, are not meaningfully defined for financials, we remove the stocks from this sector in our empirical tests.”
They then made a second risk-related adjustment. They noted:
“the standard HML factor takes on large persistent industry bets, which arise because certain industries are structurally cheaper than others. For instance, HML is systematically long typical value industries such as utilities, and systematically short typical growth industries such as technology.”
Prior research showed that value strategies are more effective at selecting stocks within industries than at allocating across industries. The implication is that higher risk-adjusted returns can be obtained by neutralizing industry bets. I would add that neutralizing industries bets reduces the issue of tracking variance regret that can create behavioral problems for investors who focus on recent performance. To address these issues:
“For Global-ex-US, we apply region and industry neutrality, using the same sectors and defining the regions as North America, Europe, and Pacific. For Emerging Markets, we use country neutrality, as countries are the primary risk factor in these markets.”
Their third adjustment was to alter the construction rules for HmL. The reason is that HmL gives a weight of 50 percent to small-cap stocks which only comprise 10 percent of the total market capitalization. Their universe consists of all stocks in the standard (large/mid-cap) MSCI index at that moment, which is roughly comparable to the big-cap universe of Fama-French. This alteration raises the hurdle because HmL (and other value metrics) have been more effective in smaller stocks which they exclude.
Their sample period starts in January 1986 for the US and Developed-ex-US and January 1996 for Emerging Markets, the earliest start dates available, and ends in June 2020. Portfolios are rebalanced monthly, and all returns are total returns in US dollars. Following is a summary of their findings:
- There is a monotonously decreasing return pattern going from the portfolios with the cheapest (Q1) to the portfolios with the most expensive (Q5) stocks.
- The top Q1-minus-bottom Q5 value factor exhibits full-sample value premia of over 5% for the US and more than 8% for Developed-ex-US and Emerging Markets, with t-statistics that are all highly significant.
- For each region, the top and bottom portfolios contribute jointly to the value premium and are both highly significant—the value premium is not critically dependent on the short side where limits to arbitrage tend to be most prevalent.
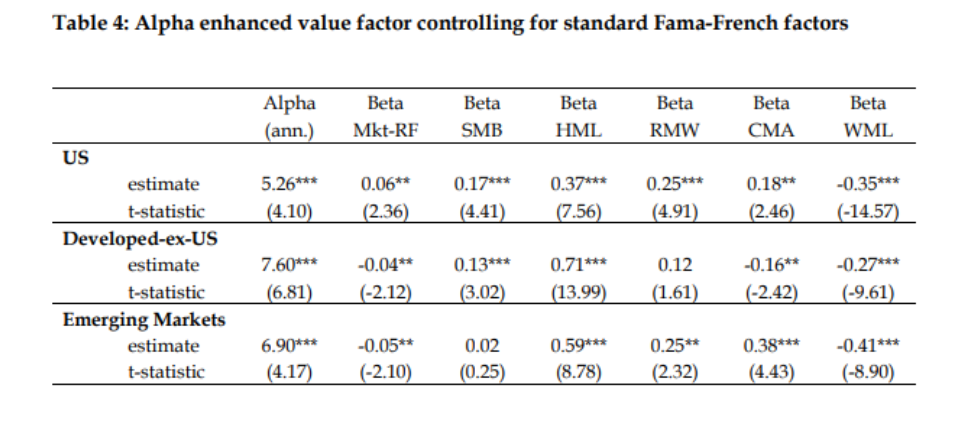
- The enhanced value factor loads heavily on the standard HML value factor—the strategy is still first and foremost a value strategy and has not been turned into something completely different. It also has strong negative loadings on the momentum factor, which is consistent with HmL based value.
- The enhanced value strategy is not subsumed by other factors, showing significant alphas in the same 5-8 percent range after considering other factor loadings.
- These findings are robust to using the big-cap versions of the Fama-French factors.
Blitz and Hanauer did add that the substantial widening in the spread of multiples for growth versus value stock, very similar to the late 1990s episode, led to a pronounced value drawdown in every region in the final years of the sample.
“However, the enhanced value strategy is much better able to absorb this drawdown given its much stronger long-term track record. Whereas existential concerns are understandable for HML, they do not appear justified for the enhanced value strategy.”
They concluded:
“Based on these results we conclude that our various enhancements to the standard value factor are effective at resurrecting the value premium.”
In other words they resurrected the value premium.
Blitz and Hanauer also made these important observations:
- The widening of the valuation spread in the late nineties was followed by a mean-reversion of the valuation spread in the early 2000s, which resulted in a massive outperformance of value stocks over growth stocks. More formally other researchers they cited have established a significant positive relation between valuation spreads and the future value premium.
- The net spread widening that occurred over our sample period means that realized returns over this period might underestimate the ‘true’ magnitude of the value premium.
- Diverging valuation multiples between value and growth stocks are inconsistent with the concern that the value premium may have been arbitraged away since it is so well known, and substantial money has been invested in value strategies.
Summary
The severe underperformance of value strategies since 2017 has led many to question the existence and, thus, the future of the value premium. Blitz and Hanauer demonstrate that simple adjustments to the standard HmL value metric resurrect the premium over the long term. And importantly, the severe underperformance caused by the widening of multiple spreads has resulted in a large ex-ante value premium, similar to what we experienced in early 2000. In other all risky assets go through long periods of drawdowns. It takes discipline to treat such periods as noise, not fundamental changes to investment theory. As famous value investor Warren Buffett noted, my favorite holding period is forever.
About the Author: Larry Swedroe
—
Important Disclosures
For informational and educational purposes only and should not be construed as specific investment, accounting, legal, or tax advice. Certain information is deemed to be reliable, but its accuracy and completeness cannot be guaranteed. Third party information may become outdated or otherwise superseded without notice. Neither the Securities and Exchange Commission (SEC) nor any other federal or state agency has approved, determined the accuracy, or confirmed the adequacy of this article.
The views and opinions expressed herein are those of the author and do not necessarily reflect the views of Alpha Architect, its affiliates or its employees. Our full disclosures are available here. Definitions of common statistics used in our analysis are available here (towards the bottom).
Join thousands of other readers and subscribe to our blog.