When it comes to Value and Momentum investing we often get asked the following set of questions:
- Should I use value and momentum, in one screen, to form a single portfolio of stocks? (“Blended”, “combined”, or “integrated”)
- Or should I focus on the value and momentum factor separately, and then combine the factor portfolios? (“Pure”, “Separated”, or “mixed”)
This debate of “combine versus separate” is sometimes referred to as “blend versus pure” or the “mix versus integrate” debate. See these articles for more information:(1)
How to Combine Value and Momentum Investing Strategies
Value and Momentum Factor Portfolio Construction
Or check out this video:
One can find compelling research papers and blog posts on style investing that support both strategies. We recommend readers explore all of these ideas.
Our study adds to the discussion on the topic. We specifically examine mid-cap and large-cap firms in both the U.S. and international developed markets. We also examine only two factors—Value and Momentum. This is slightly different than other studies, which include numerous other factors, and may include smaller stocks.
The summary of the findings is as follows:
- For concentrated factor portfolios, a 50/50 allocation to (1) a Value portfolio and (2) a Momentum portfolio historically yielded higher returns than a portfolio that combines the Value and Momentum signals together. This is true in the U.S. and international samples.
- For the U.S. results, as the number of stocks in the portfolios increases, the returns differential between the “separate” and the “combined” signals gets closer.(2)
- When examining risk-adjusted measures, such as the Sharpe ratio, the question of “separate or combined?” does not have a clear winner. This is true in the U.S. and international samples.
At a high level, the overall takeaway should be that if one is using concentrated portfolios, factor portfolios formed separately, but combined at the portfolio level, have historically generated higher returns. Sharpe ratios, a measure of risk-adjusted returns, would suggest that there is no clear winner.
The study setup and results are below.
A PDF version of this study on value and momentum investing is available here.
Value and Momentum Investing: Data and Methodology
For this study, we set the initial universe to be the 1,000 largest firms in each universe (U.S. or International). We only examine common stocks and exclude REITs from the starting universe. We run the tests in both the U.S. market and in Developed International markets (such as countries in the MSCI EAFE Index). All data is from FactSet and results run from 1/1/1992 through 4/30/2021.
Portfolios are formed once a quarter and we assume the portfolios are formed as of the close of quarter-ending months (12/31, 3/31, 6/30, 9/30). U.S. fundamental data is lagged 3 months, International fundamental data is lagged 6 months. Prices and Price returns are not lagged.
The portfolios are formed as described below:
- Separate Portfolios are formed by selecting the top 50, 75, 100, 150, or 200 stocks on either Value or Momentum.
- Combined-signal Portfolios are formed by selecting the top 100, 150, 200, 300, or 400 stocks on the combined Value and Momentum signals.
- The signal is formed by ranking all the stocks, from 1 to 1,000, on the Value signal and the Momentum signal, independently. We re-rank the stocks on the averaged Value and Momentum rank. We then select the top N stocks on the combined signal.
- All the portfolios are equal-weighted.
- The Value signal is earnings-to-price (E/P).
- As readers know, we prefer and use EBIT/TEV. However, when using this measure, we normally exclude financial stocks. Since this affects the universe, we show the results in the Appendix–the main results are the same using this measure.
- The Momentum signal is the past 12 months’ stock return, excluding the prior month.
- When forming the Universe on Value and Momentum, we only include the stocks amongst the 1,000 largest firms that have values for both the Value and Momentum signals.
- All returns are total returns and include the reinvestment of dividends.
- Returns are gross of any transaction costs or management fees.
As noted above, the number of stocks in the Separate Portfolios and the Combined-Signal Portfolios are not the same. The Separate Portfolios range from 50-200 while the Combined portfolios range from 100-400.
Why?
If we have 100 Value stocks and 100 Momentum stocks, and form a 50/50 portfolio, we are allocating to ~200 stocks.(3) As such, we will compare this ~200 stock portfolio to a 200 stock portfolio formed on the combined Value and Momentum signals.
The results to the U.S. and International portfolios are below.
U.S. Value and Momentum Investing Results
First, we compare the compound annual growth rates (CAGR) of the combined-signal and separate portfolios in the U.S. market, specific to Value and Momentum investing.
Portfolio definitions:
- Combined-Signal: This portfolio uses the “combined” signal on Value and Momentum to pick N stocks. For example, the 150-stock portfolio picks the top 150 stocks on the combined rank of Value and Momentum.
- Separate (then 50/50): This portfolio uses the Value and Momentum signals separately to first form two portfolios, a Value portfolio, and a Momentum portfolio. We then allocate 50% to the Value portfolio, and 50% to the Momentum portfolio. For example, the 150-stock portfolio has a 50% allocation to a 75-stock Value portfolio and a 50% allocation to a 75-stock Momentum portfolio. Thus, the combined portfolio holds around 150 stocks.(4)
The results are shown below for the U.S. Value and Momentum portfolios, using E/P as the Value measure.
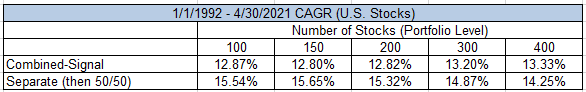
Source: Author’s Calculations. The results are hypothetical results and are NOT an indicator of future results and do NOT represent returns that any investor actually attained. Indexes are unmanaged and do not reflect management or trading fees, and one cannot invest directly in an index.
Visually:
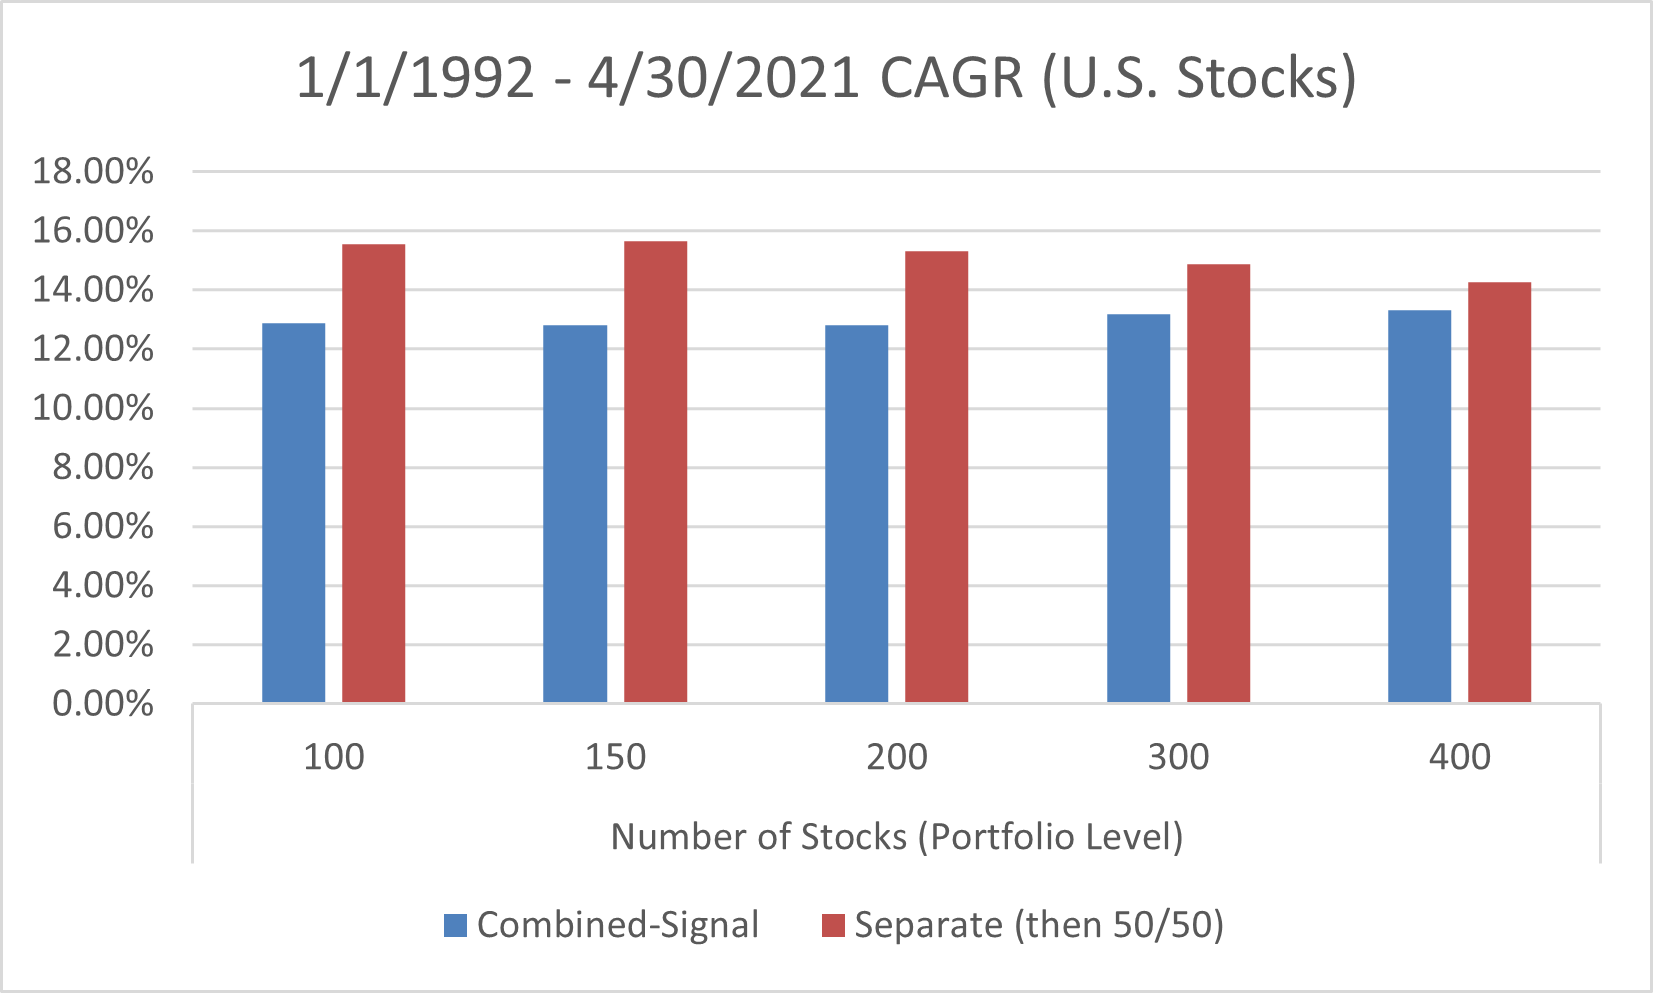
Source: Author’s Calculations. The results are hypothetical results and are NOT an indicator of future results and do NOT represent returns that any investor actually attained. Indexes are unmanaged and do not reflect management or trading fees, and one cannot invest directly in an index.
As can be seen above, the CAGR for the separate portfolios (then combined at the portfolio level), is higher in all instances when compared to the combined-signal portfolios.
However, as one adds more stocks, the CAGR differential between the two portfolios does get smaller.
However, the results above assume a monthly rebalancing to the 50/50 weights amongst the separate Value and Momentum portfolios. For most individuals and advisors, having to rebalance the portfolio once a month can be a hassle and also can cause short-term taxes.
To alleviate those concerns, the results below assume that the 50/50 allocations to the separate portfolios are only done once a year.(5) The weights between Value and Momentum will now vary throughout the year, allowing the winning factor to gain a higher allocation until the next annual rebalance back to 50/50.(6)
As is shown below, the results are similar.
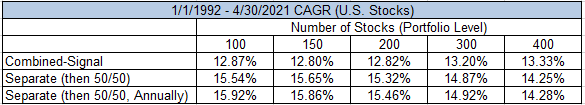
Source: Author’s Calculations. The results are hypothetical results and are NOT an indicator of future results and do NOT represent returns that any investor actually attained. Indexes are unmanaged and do not reflect management or trading fees, and one cannot invest directly in an index.
Visually:
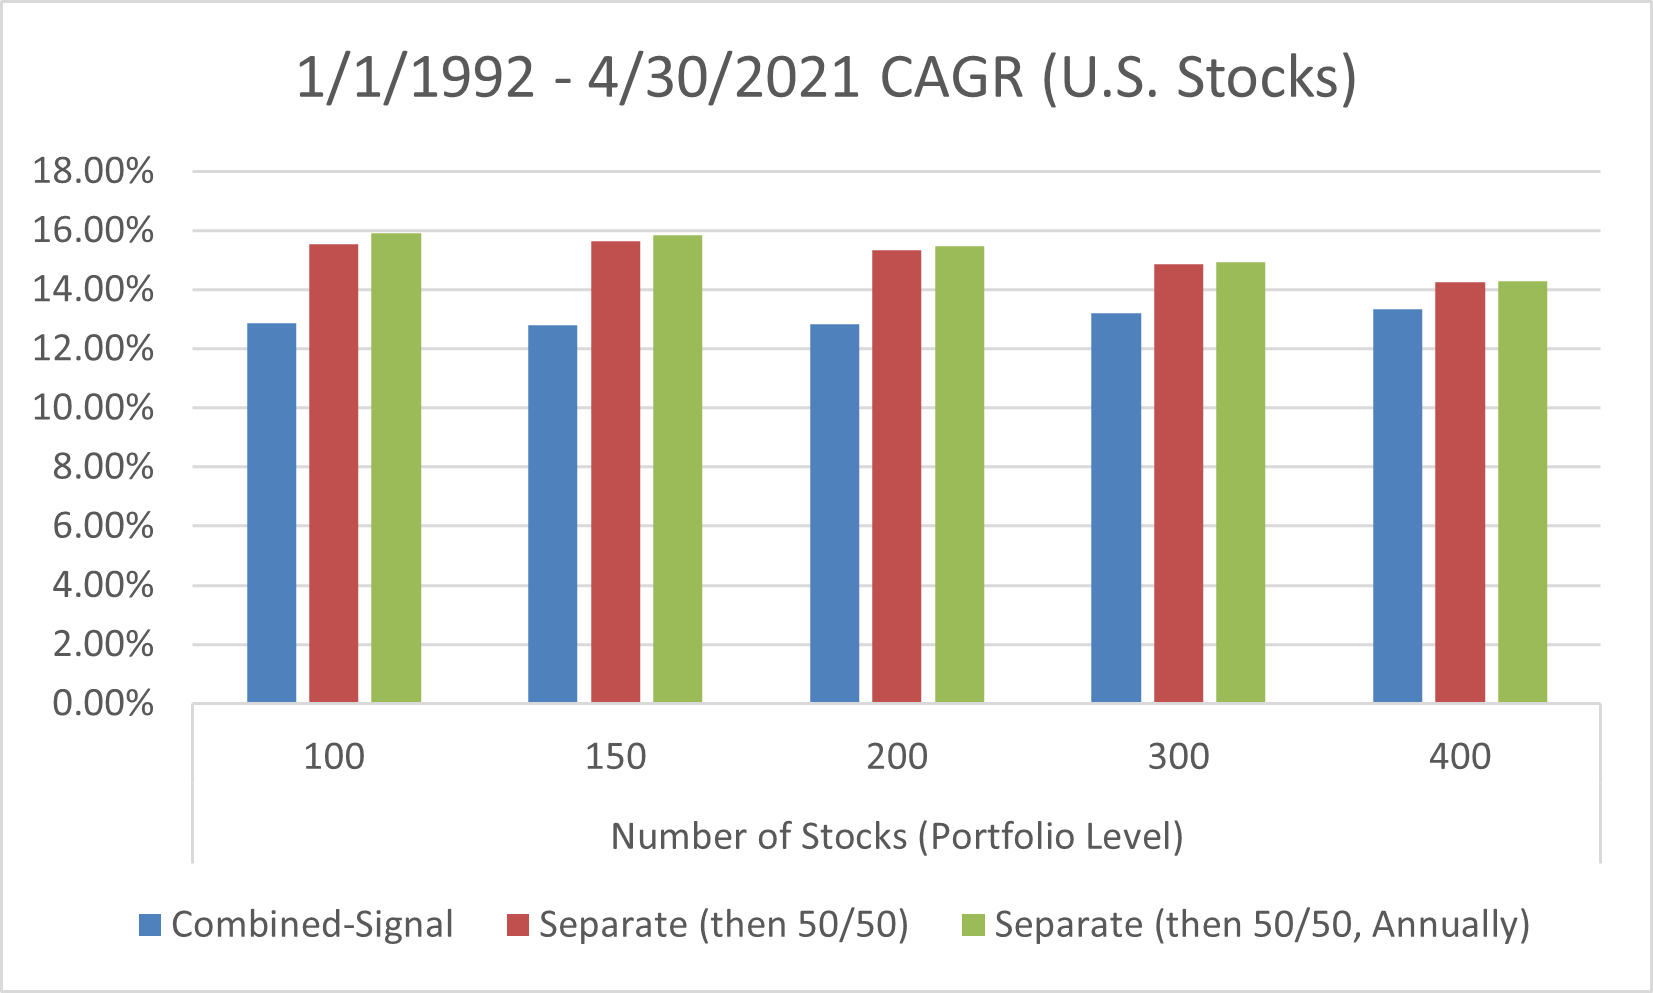
Source: Author’s Calculations. The results are hypothetical results and are NOT an indicator of future results and do NOT represent returns that any investor actually attained. Indexes are unmanaged and do not reflect management or trading fees, and one cannot invest directly in an index.
Another common question brought up is that portfolios using combined signals may have slightly lower standard deviations, and thus, may have higher risk-adjusted returns. To test this, we show the Sharpe ratios of the portfolios below.
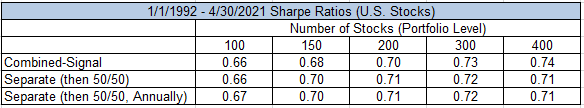
Source: Author’s Calculations. The results are hypothetical results and are NOT an indicator of future results and do NOT represent returns that any investor actually attained. Indexes are unmanaged and do not reflect management or trading fees, and one cannot invest directly in an index.
As can be seen above, the Sharpe ratios are pretty similar across both the Separate and Combined factor portfolios. Thus, from a risk-adjusted returns perspective, one would be ambivalent between a Combined or Separate approach.(7)
International Value and Momentum Investing Results
Similar to the U.S., we first compare the compound annual growth rates (CAGR) of the combined and separate portfolios in International Markets, focusing on Value and Momentum investing.
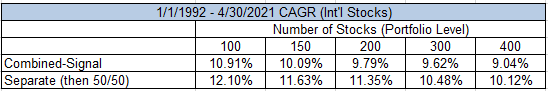
Source: Author’s Calculations. The results are hypothetical results and are NOT an indicator of future results and do NOT represent returns that any investor actually attained. Indexes are unmanaged and do not reflect management or trading fees, and one cannot invest directly in an index.
Visually:
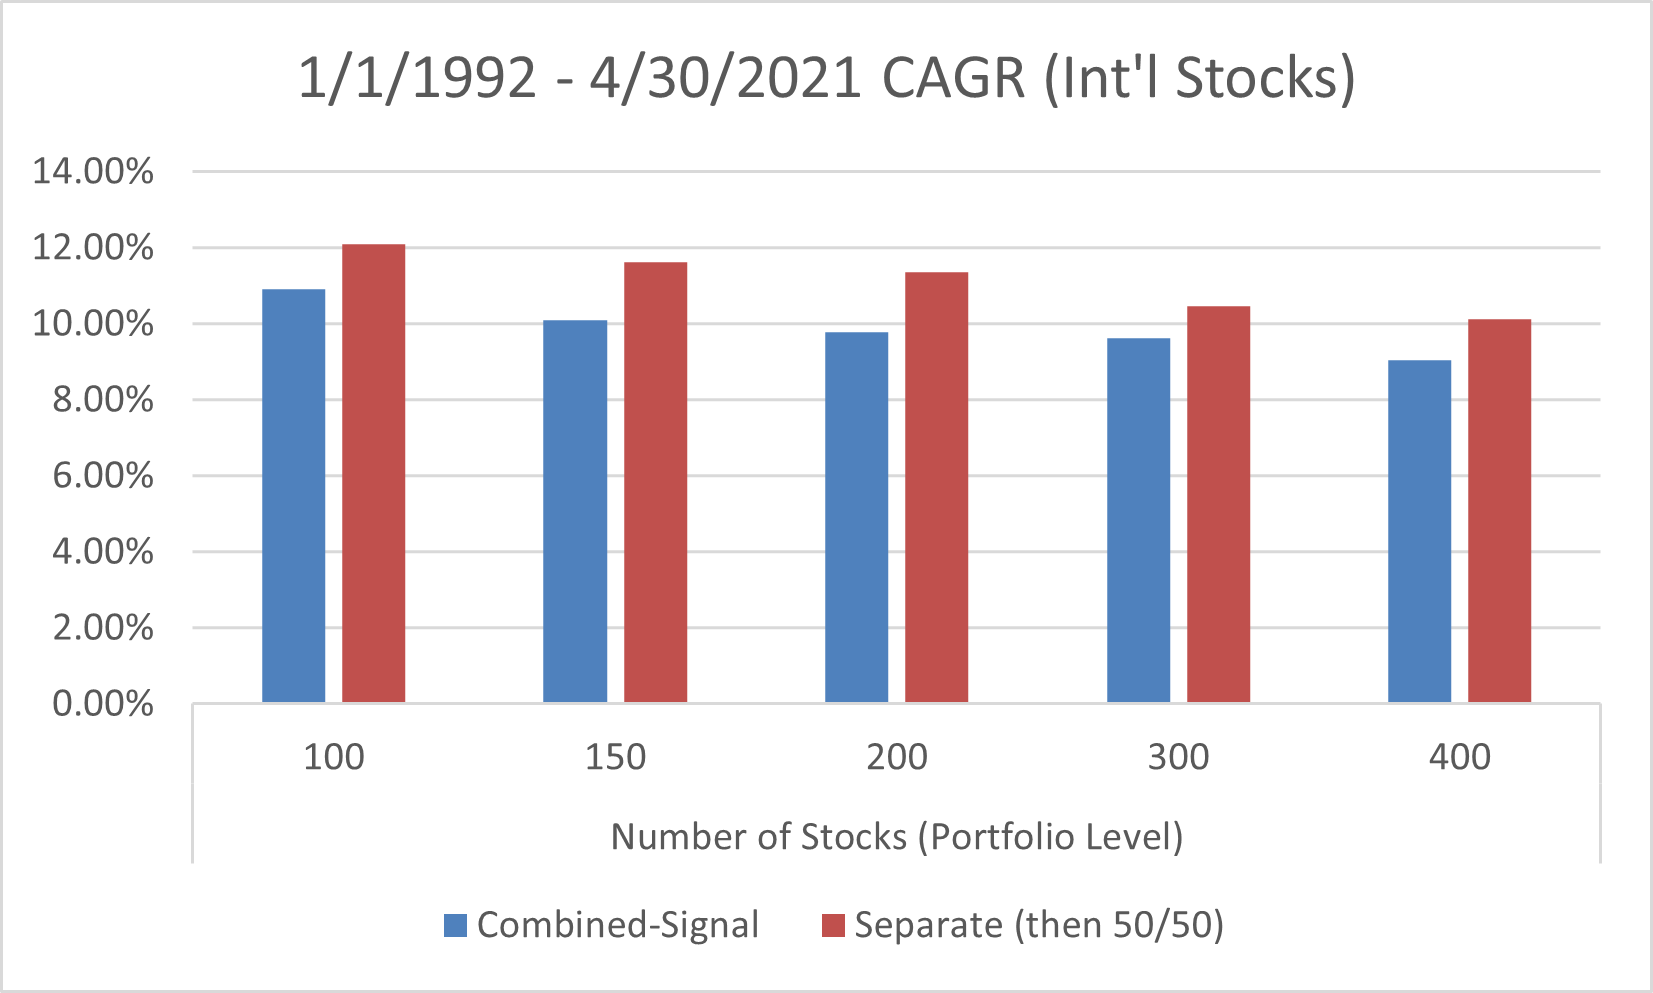
Source: Author’s Calculations. The results are hypothetical results and are NOT an indicator of future results and do NOT represent returns that any investor actually attained. Indexes are unmanaged and do not reflect management or trading fees, and one cannot invest directly in an index.
As can be seen above, the CAGR for the separate portfolios (then combined at the portfolio level), are higher in all instances when compared to the combined-signal portfolios.
Similar to the U.S. results, we show the results when assuming that the 50/50 allocations to the separate portfolios are only done once a year. The weights between Value and Momentum will now vary throughout the year, allowing the winning factor to gain a higher allocation until the next annual rebalance back to 50/50.
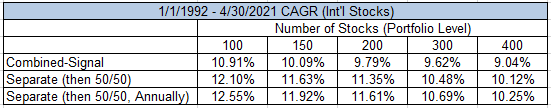
Source: Author’s Calculations. The results are hypothetical results and are NOT an indicator of future results and do NOT represent returns that any investor actually attained. Indexes are unmanaged and do not reflect management or trading fees, and one cannot invest directly in an index.
Visually:
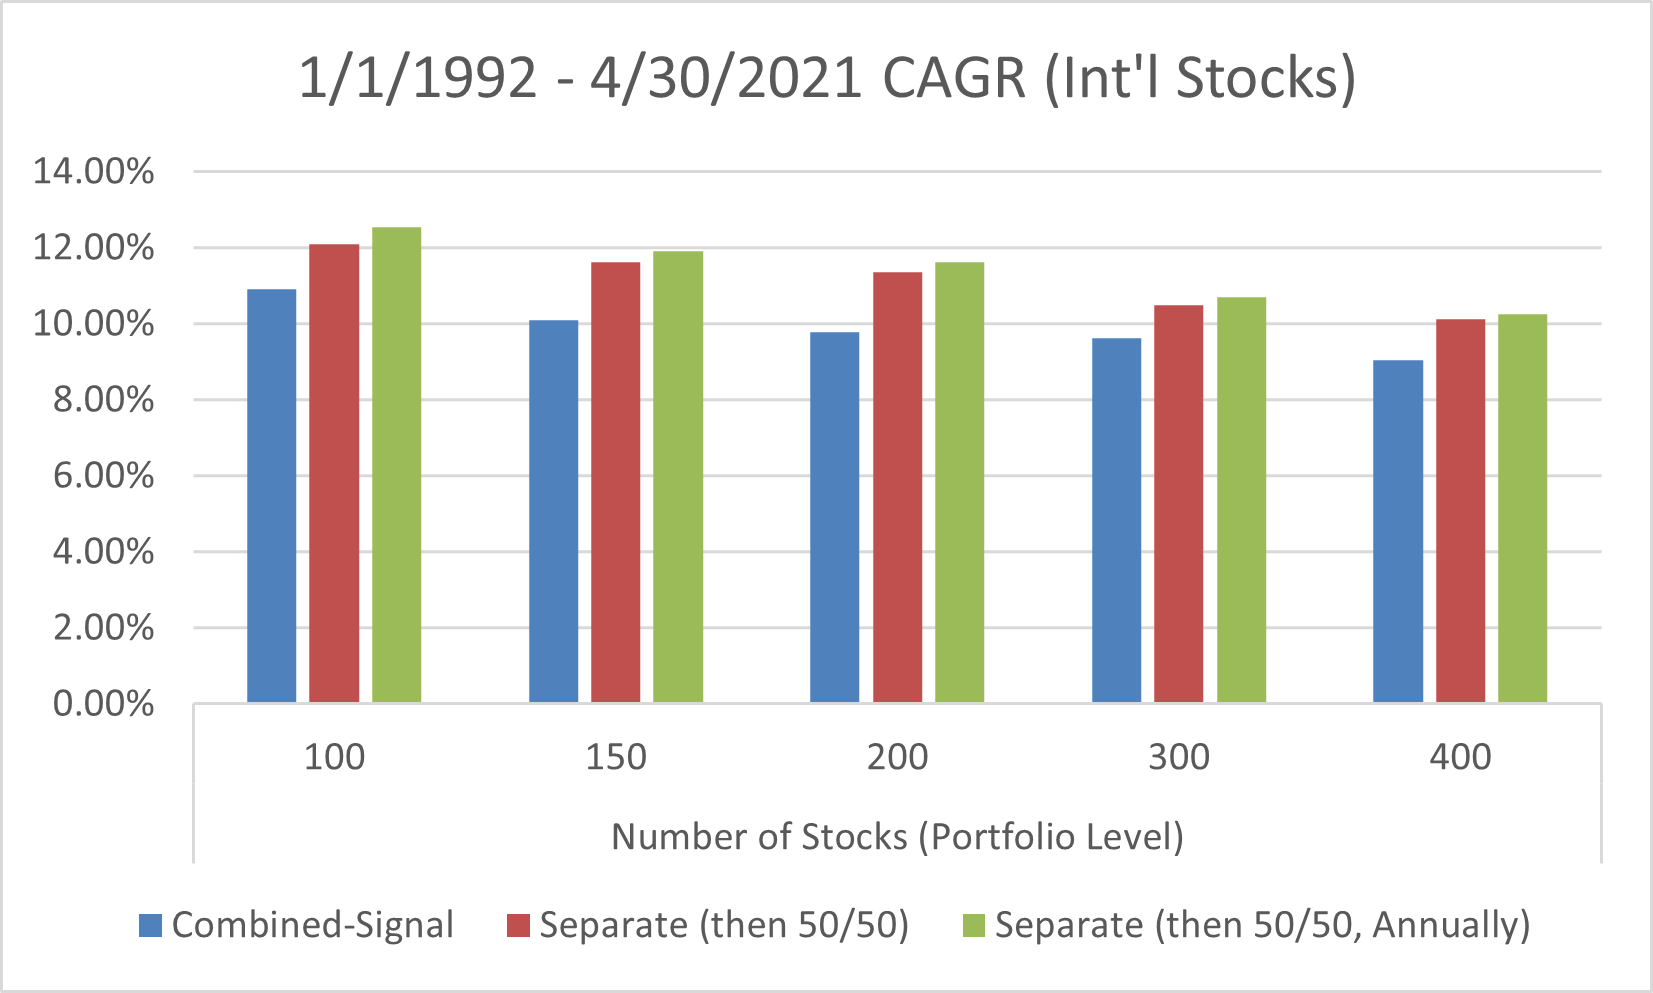
As is shown above, the results are similar to the U.S. market.
Last, we examine the risk-adjusted return metric, the Sharpe ratio, for International markets.
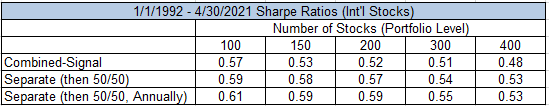
Source: Author’s Calculations. The results are hypothetical results and are NOT an indicator of future results and do NOT represent returns that any investor actually attained. Indexes are unmanaged and do not reflect management or trading fees, and one cannot invest directly in an index.
Similar to the U.S. results, the Sharpe ratios are pretty similar across both the Separate and Combined factor portfolios. Once again, from a risk-adjusted returns perspective, one would be ambivalent between a Combined or Separate approach.
Conclusion
This article examined a common question—for Value and Momentum Investing, what is the best way to combine factors? While not the first article on the topic, we provide another set of insights. When examining mid-cap and large-cap stocks in both the U.S. and international markets, and keeping the number of stocks in the portfolio the same, more concentrated portfolios historically had higher returns in the “Separate, then combined” Portfolio as opposed to the “Combined-signal Portfolio.” In the U.S., as one adds more stocks, the return differential gets smaller. Last, from a risk-adjusted returns perspective, there is no clear-cut winner/loser.
One additional benefit, not quantified here, for the “separate, then combined” portfolio approach, is that this methodology allows for a better ex-post understanding of the returns since the two factors are separate.
As with anything factor investing, we recommend that investors get educated and pick the process that they feel the most comfortable in using.
Please see the following links for more information about (1) How to combine Value and Momentum Investing Strategies and (2) Why investors should combine Value and Momentum Investing Strategies.
Appendix Analysis — Using EBIT/TEV as the Value Metric
The main results above focus on using E/P as the Value measure. However, we prefer to use EBIT/TEV. Doing so, we also eliminate financial firms. Thus, we wanted to ensure that the results above are similar if one (1) eliminates financial firms from the 1,000 largest stocks and (2) uses EBIT/TEV as the Value measure.
Takeaway: As is shown below, the results when using EBIT/TEV are similar to the E/P results.
U.S. Results using EBIT/TEV as Value Measure
CAGR:
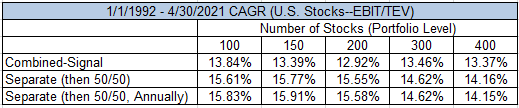
Source: Author’s Calculations. The results are hypothetical results and are NOT an indicator of future results and do NOT represent returns that any investor actually attained. Indexes are unmanaged and do not reflect management or trading fees, and one cannot invest directly in an index.
Sharpe Ratio:
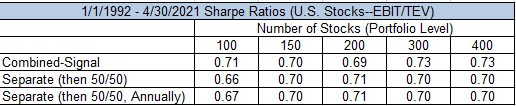
Source: Author’s Calculations. The results are hypothetical results and are NOT an indicator of future results and do NOT represent returns that any investor actually attained. Indexes are unmanaged and do not reflect management or trading fees, and one cannot invest directly in an index.
International Results using EBIT/TEV as Value Measure
CAGR:
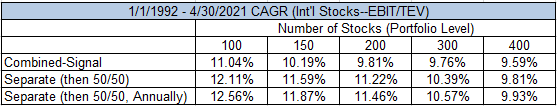
Source: Author’s Calculations. The results are hypothetical results and are NOT an indicator of future results and do NOT represent returns that any investor actually attained. Indexes are unmanaged and do not reflect management or trading fees, and one cannot invest directly in an index.
Sharpe Ratio:
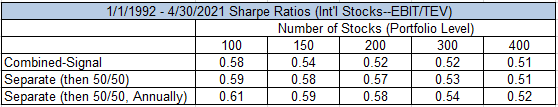
Source: Author’s Calculations. The results are hypothetical results and are NOT an indicator of future results and do NOT represent returns that any investor actually attained. Indexes are unmanaged and do not reflect management or trading fees, and one cannot invest directly in an index.
References[+]
| ↑1 | Note–there are additional papers on this topic. |
|---|---|
| ↑2 | There is little to no differential change in International markets. |
| ↑3 | Noting that at times there can be less that 200 stocks, if there is a stock that is both in the Value portfolio and the Momentum portfolio. |
| ↑4 | Again noting that that number of stocks may be under 150 if there are any stocks in both the Value portfolio and the Momentum portfolio. |
| ↑5 | We assume as of the close on 12/31 each year. |
| ↑6 | Note, this is a simplistic way (not exactly the same) of gaining access to Factor Momentum. |
| ↑7 | Of course, one can also add other “signals” to the Value portfolio (such as quality) and the Momentum portfolio (such as lower volatility) to enhance the risk-adjusted return statistics. |
About the Author: Jack Vogel, PhD
—
Important Disclosures
For informational and educational purposes only and should not be construed as specific investment, accounting, legal, or tax advice. Certain information is deemed to be reliable, but its accuracy and completeness cannot be guaranteed. Third party information may become outdated or otherwise superseded without notice. Neither the Securities and Exchange Commission (SEC) nor any other federal or state agency has approved, determined the accuracy, or confirmed the adequacy of this article.
The views and opinions expressed herein are those of the author and do not necessarily reflect the views of Alpha Architect, its affiliates or its employees. Our full disclosures are available here. Definitions of common statistics used in our analysis are available here (towards the bottom).
Join thousands of other readers and subscribe to our blog.