Part 1: The End of Accounting
- This is the first part of a series of guest posts by Kai Wu, the CIO & Founder of Sparkline Capital.
The Factor Zoo
As readers of Alpha Architect’s blog, you’re certainly familiar with factor investing. Factors are quantifiable firm characteristics that explain cross-sectional stock returns. While some factors merely explain risk (e.g., industry), others are also associated with positive expected returns (e.g., value, momentum).
Since the dawn of academic finance, researchers have identified hundreds of factors. In the past decade, the number of published factors has proliferated exponentially.
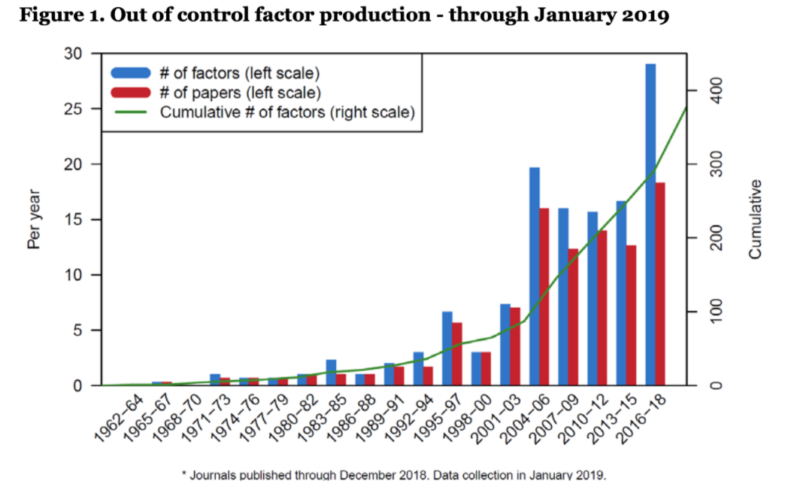
However, all these factors have one thing in common. They are based on two types of data:
- Market data: price, volume
- Accounting data: sales, earnings, book value, cash flow
In The End of Accounting, Baruch Lev and Feng Gu, two accounting professors, lament that accounting has largely remained unchanged for the past century. They point to the fact that US Steel’s 1902 annual report has essentially the same financial information as its 2012 report (but with far fewer stock photos).

So while the universe of accounting data has remained static for a century, academics are somehow still finding new signals in this haystack. Hmm…
Lev and Gu also make the point that the lack of accounting reform means it’s still optimized for the industrial era of the early 1900s. However, most value today is derived from intangible assets (e.g., intellectual property and human capital). This is a second reason why mining accounting data may prove to be a fruitless endeavor.
The Rise of Unstructured Data
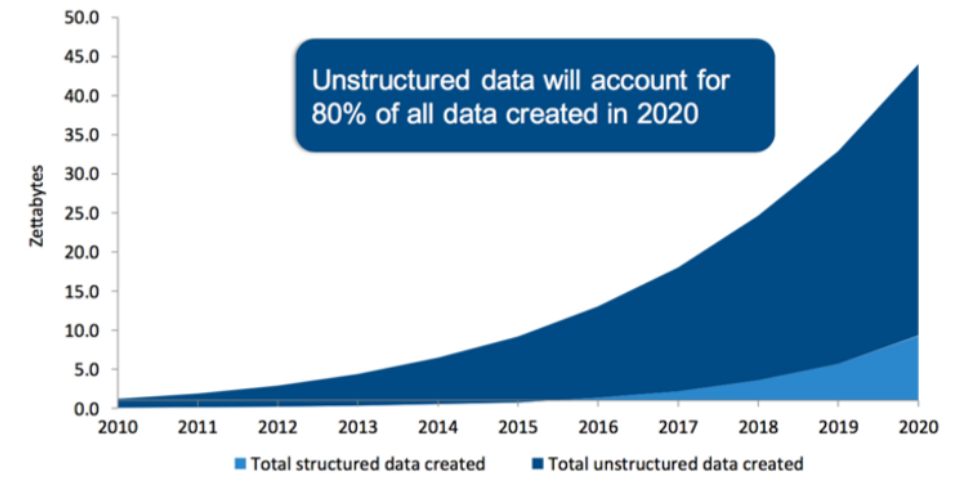
Accounting data may be the only form of data that hasn’t grown over the past century. Every few years, more data is created than has existed in all of human history. However, 80% of this data is unstructured. This means the data does not live in an Excel spreadsheet or SQL database. Instead, it takes the form of text, images, video, and other jumbled messes.
Most of the information in company annual reports is unstructured. Glossy photos aside, there is actual useful data in, for instance, the management discussion and analysis (MD&A) section. However, this section is unstructured text, which is unintelligible for quants with traditional econometrics.
The general problem is that unstructured data is high dimensional. A single 10K can contain a vocabulary of tens of thousands of unique words. This is not good for common statistical techniques such as linear regression. Fortunately, we have a new weapon in our arsenal: natural language processing (NLP).
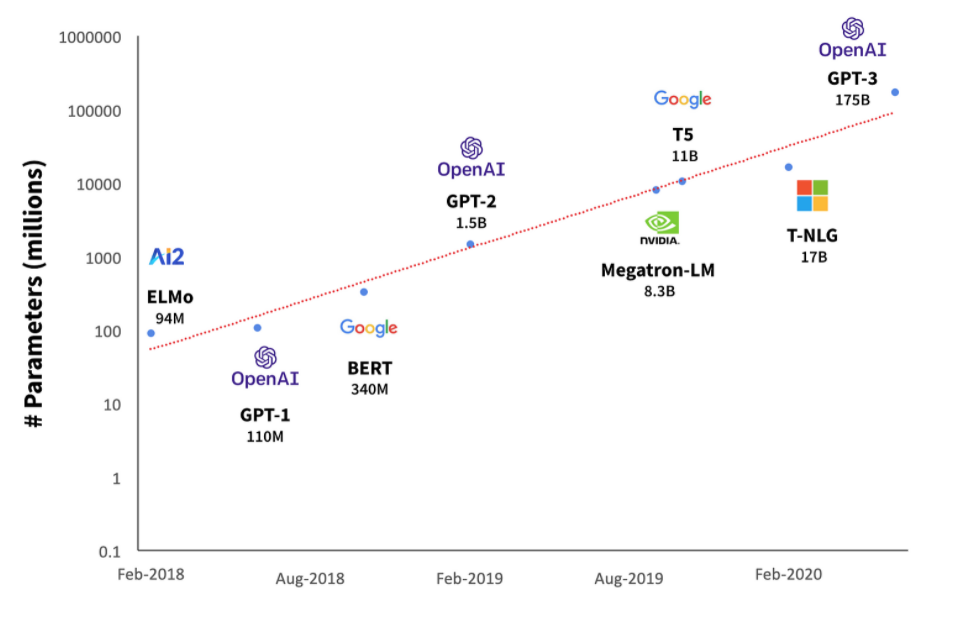
The field of NLP has exploded over the past decade. You may have heard of the recently released OpenAI GPT-3 model, which has been used to generate essays, poetry, and artwork. Like Moore’s Law, the power of NLP has been increasing at an exponential rate (note the log Y-axis).
However, we don’t even need these cutting edge models to derive meaning from financial text (such as MD&A). Even much simpler techniques can produce powerful and robust results. We’ll provide an example later.
A Brave New World
Let’s now return to our initial problem. We believe accounting data is “tapped out,” implying that despite herculean effort, the academy’s well-intentioned quest to find more accounting factors may be fruitless, or worse, data mining. But once you cross the Rubicon into the world of unstructured data, suddenly the fruit is hanging much lower.
Once we’ve cast these shackles off, there are a nearly infinite number of dimensions to explore. We can now start defining factors that would be more familiar to those of a fundamental analyst. Which companies are implementing disruptive technology? Which firms are employing a platform business model? Which companies are winning the war for talent?
These text-based factors are similar to traditional factors. In a statistical sense, they are quantifiable company characteristics that explain cross-sectional variance and may also have positive expected returns. In a broader sense, they capture important missing dimensions of business and markets.
We’ll provide just a single example of a text-based factor in this post. However, in future posts we will cover additional examples. Hopefully these together will provide a good sense of why we believe text-based factors can be a valuable addition to the factor investor’s arsenal.
Part 2: Platform Companies
Note: This section is a summary of The Platform Economy (Dec 2020). If you’re interested in learning more, we recommend you read the full article.
The Rise of Platforms
Platform companies have come to dominate the S&P 500. The past couple of years have seen the IPO of many important platform companies.
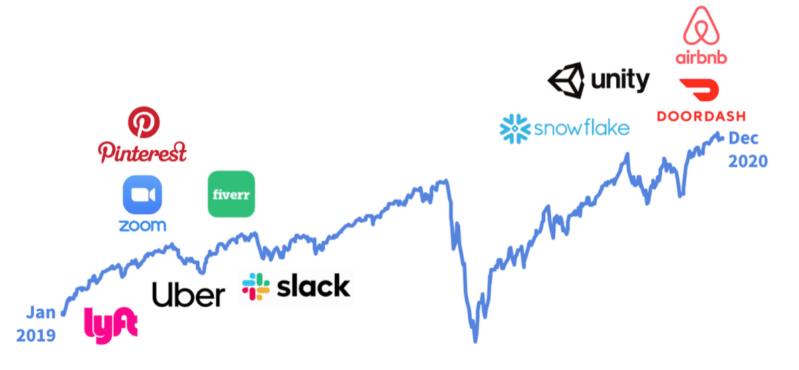
Despite the fanfare, these newly public companies are dwarfed by the existing mega-platforms. The five largest US companies (Apple, Microsoft, Amazon, Google, Facebook) all operate extremely successful technology platforms. These tech giants represent over $7 trillion in market cap and 20% of the S&P 500. By our calculations, the number of platforms in the S&P 500 has doubled from 50 to 100 over the past decade. This trend is set to continue. There are dozens of private “unicorns” ripe to join the public markets. Many of these companies are platforms.
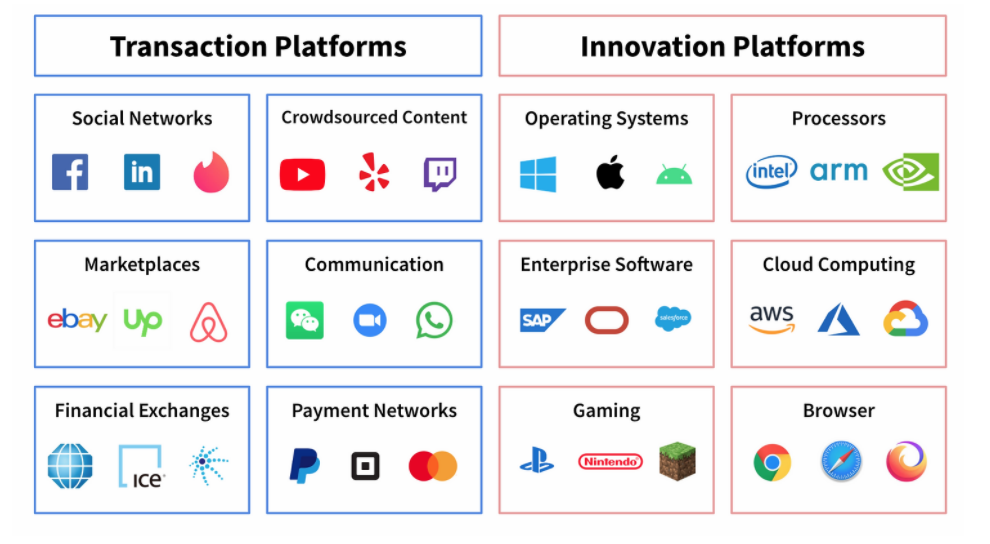
We define platform companies as those that externalize the means of production, orchestrating vast networks of external consumers and producers. Our taxonomy splits platforms into two types. Transaction platforms facilitate exchanges between users, while innovation platforms provide technological foundations for third-party innovations.
Finding Platforms
For most fundamental analysts, identifying a platform is easy. After a quick read of Uber’s 10K, you’ll know it is clearly a platform. In fact, they mention the word “platform” several times in their business description. By contrast, Lam Research is also a tech company but employs a traditional industrial-era business model.

The problem with this toy example is that it doesn’t scale. Our analyst cannot read 10,000 10-Ks. Even if she could, it would be hard to enforce a consistent and objective criteria. While this example is black and white, there are many shades of gray. We initially looked at lists of platforms put together by VCs, researchers, and consultants, only to discover that nobody could really agree with each other.
The final problem with human-compiled lists is the risk of survivorship bias. While it’s easy to come up with names like Airbnb and Facebook, we often forget the losers. If we want to conduct a rigorous empirical study of the performance of publicly-traded platform companies, we need an objective, point-in-time measure.
Document Similarity
One powerful application of NLP is to compute the semantic similarity between two documents. We won’t explain it in detail here, but there is first an “encoding” step, whereby a 10,000 word document is first condensed into a denser 100 dimensional representation. This removes a lot of noise and makes the calculation much more robust. Once this is done, we can trivially calculate the similarity using simple vector math.
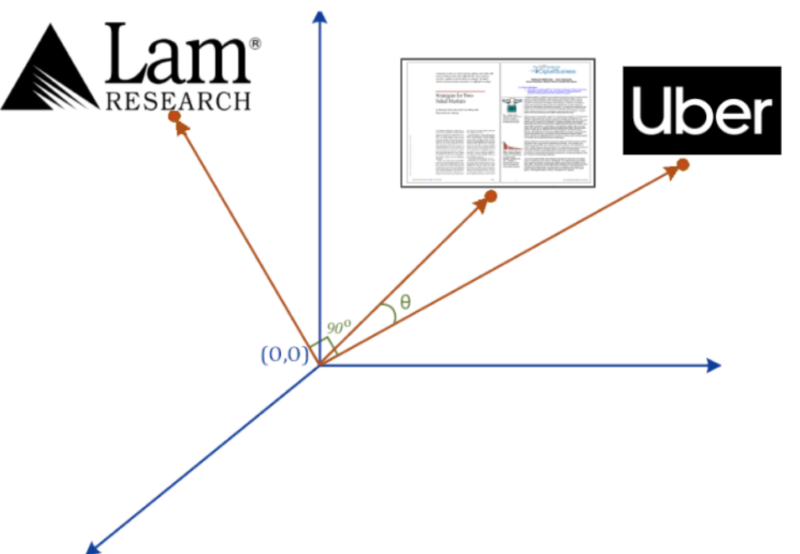
The first order of business is to determine which source material to use as our description of platforms. We decided to use two academic pieces (Strategies for Two-Sided Markets and Network Platforms – Core Concepts) both by highly regarded platform experts. Since one deals with transaction platforms and the other innovation platforms, we use them both. The key is that they were written in 2006 and 2007 before anyone knew TheFacebook.com would become Facebook.

We compare the business descriptions from tens of thousands of 10Ks to these articles. Given that each article can be represented by a 100-dimensional vector, all we have to do is look at the spatial distance between each 10K and our articles. As the exhibit below shows, Uber’s description is much closer to our articles than Lam’s.
We can use this process to generate platform scores for all public companies. Below are some of the top examples today.

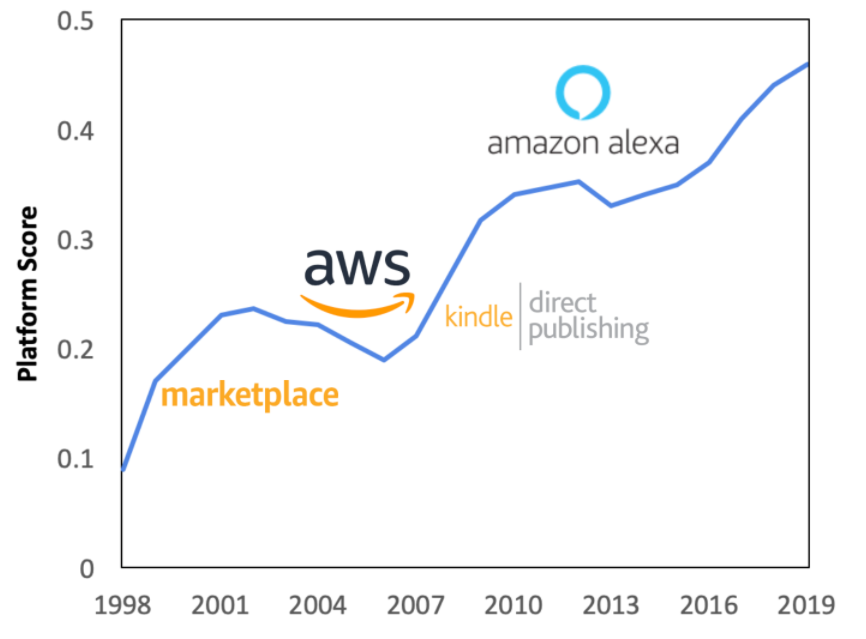
Finally, we note that our process is point-in-time. Each year, companies put out fresh 10Ks. As a result, we can see the platform score evolve over time. For example, Amazon started as a simple online book store. However, as they added platform elements such as the third-party marketplace, Amazon Web Services, and Kindle publishing, their platform score increased.
Platform Dominance
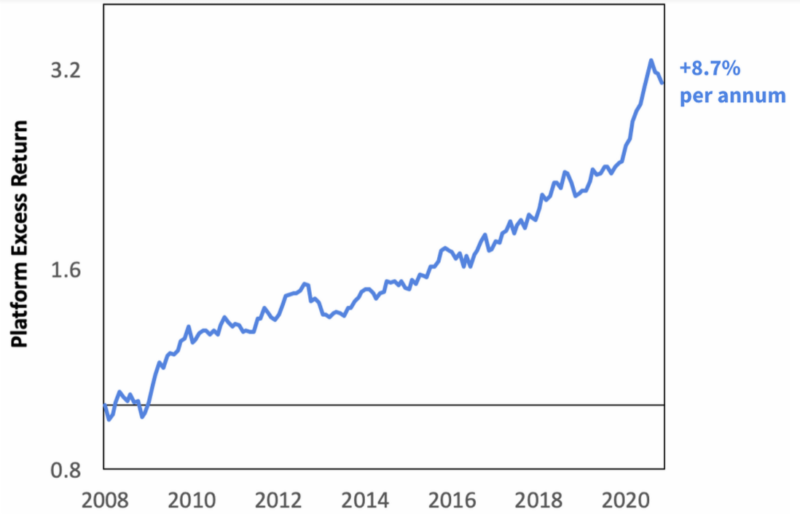
We can define a basket of platform companies by applying a hard threshold to the platform score. Any company over this threshold we will call a platform. This leaves 50-100 platforms at any point in time.
We find that this platform portfolio outperformed the stock market by over 8% per year. We also run a battery of robustness tests to control for size, company vintage, and industry. In all cases, platform companies would have still outperformed.
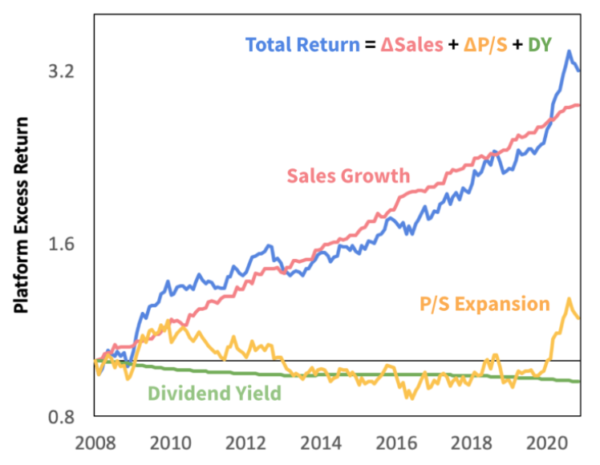
One important question is if this performance has been driven solely by rising valuations. We can decompose the returns of the platform factor into: (1) Sales Growth, (2) Multiple Expansion, (3) Income. We find that valuation has only been relevant the past year (and this largely due to the addition of hot IPOs such as Snowflake into the basket). For the most part, platforms have fundamentally outgrown the market ahead of market expectations.
The Flywheel
“Increasing returns are the tendency for that which is ahead to get further ahead, for that which loses advantage to lose further advantage. They are mechanisms of positive feedback that operate — within markets, businesses, and industries — to reinforce that which gains success or aggravate that which suffers loss. Increasing returns generate not equilibrium but instability: If a product or a company or a technology — one of many competing in a market — gets ahead by chance or clever strategy, increasing returns can magnify this advantage, and the product or company or technology can go on to lock in the market.”– W. Brain Arthur (1996)
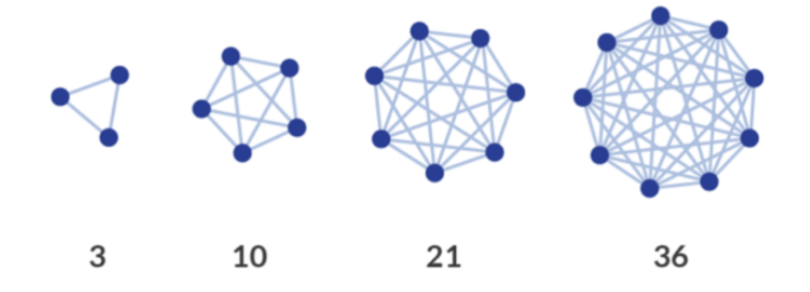
The value of a platform grows nonlinearly with the size of its network (e.g., Metcalfe’s Law). While platforms have existed for hundreds of years, globalization and the internet have massively increased the potential size of networks, greatly increasing their value. Today, Facebook alone serves 2.7 billion monthly active users.
As Arthur writes, network effects generate positive feedback loops. Thus, once a company gets the flywheel spinning, it begins a virtuous cycle. Conversely, their competitors facing user attrition may be buried in a death spiral. Thus, platform competition tends toward monopoly. While the initial challenges are considerable (e.g., chicken and egg problem), once a platform has “locked” the market, it is unlikely to be unseated easily. In many ways, platforms are qualitatively different from traditional business and deserve to be analyzed differently.
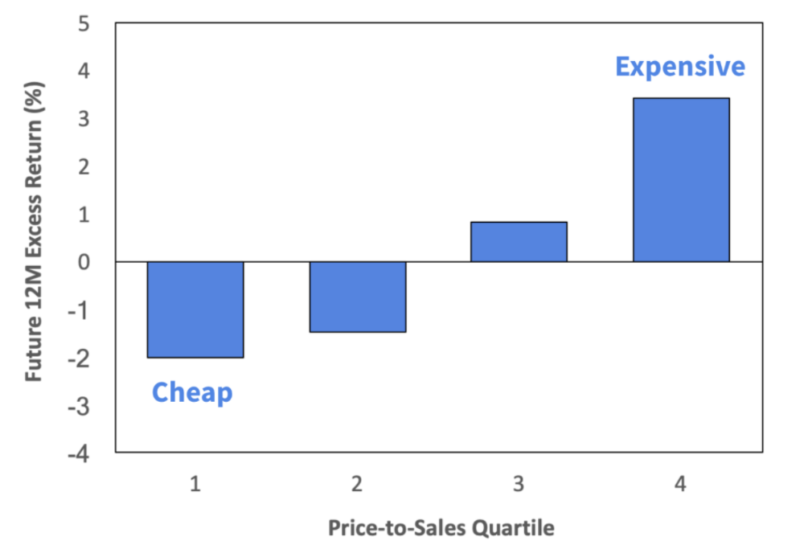
The next chart below shows the performance of a simple quantitative value strategy within our platform universe since 2008. While value hasn’t worked well in general over this period, these results are even worse than experienced in the broader market. This lends support to the notion that positive feedback and monopoly dynamics subvert mean reversion in platform markets.
The Platform Factor
There is a reasonably strong argument to simply buy the platform factor. After all, they have displayed very strong historical excess returns. The market seems to have underpriced the power of their monopoly moats (i.e., in an efficient market, losses from high valuations mean reversion should offset their superior growth). We assume this is because most investors are still focused on accounting data, and thus haven’t been able to price this factor.
On the other hand, the empirical results only span a thirteen-year period. We don’t have a hundred-year backtest as we do with some accounting factors. Of course, a hundred-year backtest wouldn’t even be possible as the tech platform is a relatively new phenomenon. Embracing the new by definition requires putting less weight on time-tested empirical regularities. You can’t have your cake and eat it too. If you’re interested in learning more, you can read the full article here: The Platform Economy (Dec 2020).
Conclusion
Despite the proliferation of factors, they are all derived from the same underlying accounting dataset. This data has remained largely static for the past century. Furthermore, the rise of intangible assets makes accounting data increasingly irrelevant. We would advocate that investors expand their factor toolkit to include text-based factors. This allows us to tap unstructured data — a massive, growing, and less mined trove of information. These factors can explain important dimensions of the economy, such as platform vs. traditional business, and may potentially offer additional sources of investment return.
Subscribe to Sparkline Capital’s monthly newsletter.
About the Author: Kai Wu
—
Important Disclosures
For informational and educational purposes only and should not be construed as specific investment, accounting, legal, or tax advice. Certain information is deemed to be reliable, but its accuracy and completeness cannot be guaranteed. Third party information may become outdated or otherwise superseded without notice. Neither the Securities and Exchange Commission (SEC) nor any other federal or state agency has approved, determined the accuracy, or confirmed the adequacy of this article.
The views and opinions expressed herein are those of the author and do not necessarily reflect the views of Alpha Architect, its affiliates or its employees. Our full disclosures are available here. Definitions of common statistics used in our analysis are available here (towards the bottom).
Join thousands of other readers and subscribe to our blog.