From 2017 through March 2020, the relative performance of value stocks in the U.S. was so poor, experiencing its largest drawdown in history, that many investors jumped to the conclusion that the value premium was dead. It is certainly possible that what economists call a “regime change” could have caused assumptions to change about why the premium should exist/persist. For example, if the value premium were purely behavioral-based, the publication of the findings of a premium could lead to its disappearance—cash flows shift valuations, eliminating the anomaly. Or it could be that some change in the economy led to the increasing rate of earnings growth of growth companies relative to the rate of earnings growth of value companies. (This did not occur, as virtually all the underperformance of value stocks was due to a dramatic increase in P/Es of growth stocks, while P/Es of value stocks remained basically unchanged. More on this later.)
Taking a different approach, Mathias Hasler, author of the August 2021 paper, “Is the Value Premium Smaller Than We Thought?” (Alternative Summary and other discussions on the death of value), sought to determine if the value premium was never as large as Fama and French had found (0.4 percent per month from July 1963 to December 1991) in their 1993 paper, “Common Risk Factors in the Returns on Stocks and Bonds.”
He began by noting:
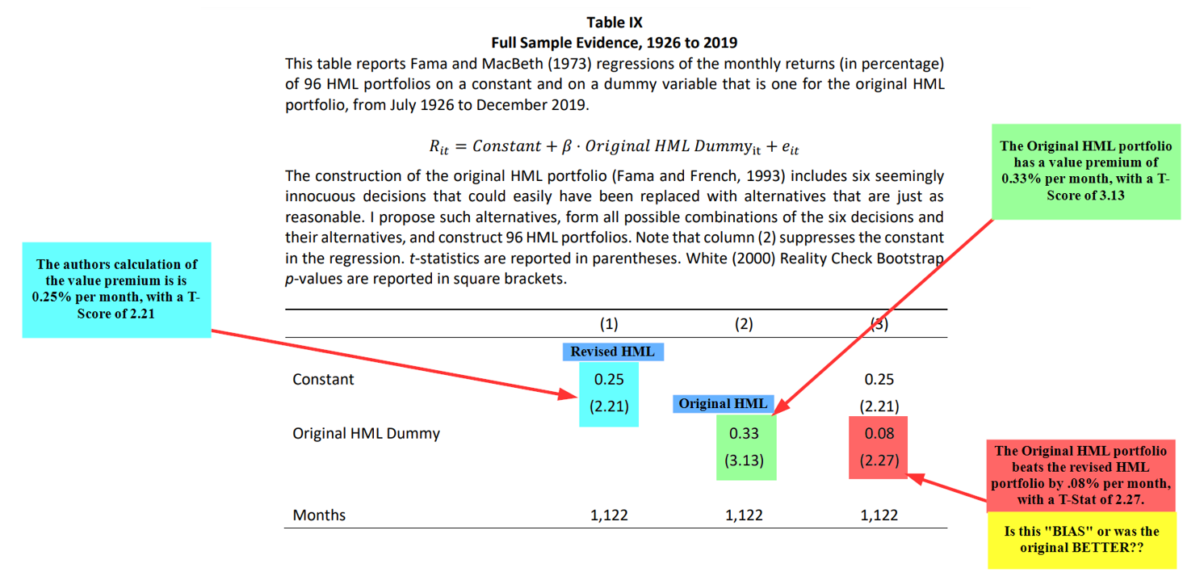
“The construction of the original HML (high book-to-market minus low book-to-market) portfolio includes six seemingly innocuous decisions that could easily have been replaced with alternatives that are just as reasonable.”
Thus, to determine if the value premium was robust to alternative metrics, he proposed alternative decisions and used them to construct 96 alternative HML portfolios, eventually collapsing them in each month into an average HML portfolio. His alternatives included varying the timing of book equity, the timing of market equity, including firms with negative book equity (which Fama-French excluded), excluding financial firms (which Fama-French included), using different decile breakpoints for defining value and growth (Fama-French used the 30th and 70th percentiles), and the timing of sorting between large and small stocks.
Following is a summary of his findings:
- In the original sample period (July 1963-December 1991), the replicated HML portfolio had an average monthly return of 0.35 percent per month (t-stat = 2.53) versus the Fama-French finding of 0.4 percent per month (t-stat = 2.91). The relatively small difference may have been a result of updating the CRSP and Compustat datasets, different links for the merging of both datasets, adjusting returns for delisting, or omitting details of the precise construction.
- In the original sample, the average monthly returns of the 96 HML portfolios ranged from 0.16 percent to 0.40 percent—86 of the 96 HML portfolios had returns that were below the original value premium estimate, and 10 HML portfolios had returns that were above it.
- In sample (July 1963-December 1991), the average estimate of the value premium was smaller, at 0.27 percent (t-stat = 1.79) than the original Fama-French estimate—the difference of 0.8 (0.35 – 0.27) percentage points was statistically significant. Out of sample, the average did lag the original Fama-French methodology, but the difference was statistically indistinguishable from zero.
- In a bootstrap test, the null hypothesis that the value premium was zero was rejected.
- Over the full sample July 1926-December 2019, the average HML portfolio had an average monthly return of 0.25 percent per month (t-stat = 2.21). The original HML portfolio had an average monthly return of 0.33 percent per month (t-stat = 3.13). The return difference between the original and the average HML portfolio was 0.08 percent per month (t-stat = 2.27) on average, suggesting to Hasler that the original value premium estimate was upwardly biased.
- The 96 HML portfolios were proxying for one underlying risk factor and not for multiple risk factors.
His findings led Hasler to conclude:
“The results suggest that the original value premium estimate is upward biased because of a chance result in the original research decisions.” He added that his findings “also raise doubts as to whether the original value premium may even be a false positive.”
Before commenting on his conclusions, we have one more important finding to review.
Value and Momentum
Hasler found that his average HML portfolio had a much more negative beta on the momentum factor compared to the original HML portfolio. For example, over the full 1927-2019 period, the average HML portfolio had a loading of -0.45 (t-stat = -8.89) on momentum versus a loading of ‑0.28 (t-stat = -4.81) for the original HML portfolio. The finding of a more negative loading on momentum for the average HML portfolio was consistent across all the sample periods.
Tests of Robustness
The idea of testing for robustness is important because it helps to determine if the original research findings might have been a random outcome or perhaps the result of a data-mining exercise. To minimize these risks, in our 2016 book, “Your Complete Guide to Factor-Based Investing,” Andrew Berkin and I listed six criteria that should be met before you consider investing in a factor: The factor should have a premium that is persistent across economic regimes; is pervasive across industries, countries, regions, and even, where appropriate, asset classes; survives transactions costs; has intuitive risk- or behavioral-based explanations for why the premium should be expected to persist and is robust to various definitions. We also presented the evidence that the value premium met all those criteria, including robustness—there was a value premium whether the value metric was price-to-book, price-to-earnings, or price-to-cash flow, and it existed across different market capitalizations (though we noted it was larger in small caps than in large caps).
With that in mind, I would note that for at least some of what Hasler called “arbitrary” decisions, Fama and French may well have had good reasons for choosing them. In addition, while Hasler concluded that his in-sample finding that the Fama-French definition of HML did notably better than the average of other choices is evidence of bias, there may be other reasons. For example, the finding that the Fama-French HML did better than the average HML could be evidence that the Fama French choices were indeed good and reasonable. To demonstrate that point, let’s return to the finding that the average HML portfolio had a greater negative loading on momentum than did the Fama-French HML.
The reason momentum is often included in asset pricing/factor models is that the evidence is that it also meets the six criteria Andrew Berkin and I established. And the momentum premium has been quite large—over the period 1927-2019, the momentum premium was 9.0 percent per year; and from 1992 to 2019, it was 5.0 percent per year. The result is that the finding of an average HML premium that was lower could be explained by the fact that the average HML had a much larger negative exposure to the momentum premium than did the Fama-French HML, causing the average HML premium to be lower! In addition, Hasler’s measure of value generated a larger average monthly return after controlling for exposure to other factors, which conflicts with his view of a smaller HML premium.
And finally, as mentioned earlier, virtually all of value’s underperformance is explained by the dramatic change in relative valuations (a repeat of the late 1990s, which was followed by the largest value premium in history when the growth bubble burst) and not by any regime change, with much faster growth in earnings for growth stocks than expected. For example, from 2010 through July 2021, the P/E of the Russell 1000 Growth Index increased almost 94 percent compared to an increase of just over 45 percent for the P/E of the S&P 500 Index, an increase of 42 percent for the P/E of the Russell 2000 Growth Index, an increase of just 13 percent for the Russell 1000 Index, and an increase of less than 1 percent for the P/E of the Russell 2000 Value Index. Also of interest is that during this period, while the S&P 500 Index provided a total return of 398 percent, far outperforming the total return of 249 percent for the Russell 2000 Value Index, earnings growth for the S&P 500 Index was virtually the same, at 181.7 percentage points versus 182.5 percentage points for the Russell 2000 Value Index.
The increase in relative valuations has left the value spread at historically very high levels. That raises the question: Does the value spread contain information about future returns? To answer that question, Avantis examined the historical data over the period December 31, 1979, to December 31, 2019. The table below makes clear that the valuation spread does contain information about future returns—the future value premium tends to be much higher following periods when the valuation spread is above the median spread—and it is well above the median today.
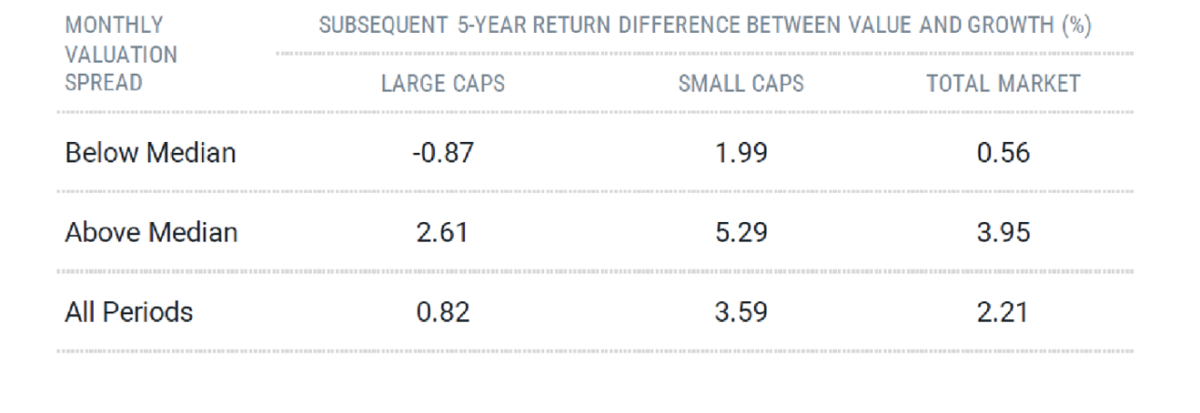
The results are hypothetical results and are NOT an indicator of future results and do NOT represent returns that any investor actually attained. Indexes are unmanaged, do not reflect management or trading fees, and one cannot invest directly in an index.
Investor Takeaway
While there are no crystal balls, there doesn’t seem to be any strong evidence supporting the belief that the value premium is dead. And there may not even be any evidence that it was either smaller than Fama and French had originally found or that it is now. The poor performance has been due to changes in what John Bogle called the “speculative return” (the change in relative valuations). In support of this idea, consider the following.
Let’s go back in time to the end of 2016 and ask if the value premium was dead based on the out-of-sample returns over the 25-year period 1992 through 2016. During this period, the Russell 1000 Growth Index returned 8.2 percent per year, underperforming the Russell 1000 Value Index return of 10.1 percent per year by 1.9 percentage points; and the Russell 2000 Growth Index returned 7.4 percent per year, underperforming the Russell 2000 Value Index, which returned 11.5 percent per year, by 4.1 percentage points. The annual average value premium was 4.5 percent, not much different than the 5.1 percent premium for the period 1927 through 1991. I don’t think anyone would have declared the value premium dead based on those figures. Yet, just a few years later, we hear a clarion cry that publication of the research and cash flows have killed the value premium. Does anyone seriously believe that 25 years was not enough time for publication to kill the premium but just a few more years did the trick? And if cash flows had killed the premium, 25 years of them should have been enough to accomplish the task. In addition, the fact that the original Fama-French findings held up to out-of-sample tests, both in the period before July 1963 and in the period 1992-2016, indicates that their choices might have been inspired, not arbitrary.
Finally, while the valuation spread is at historically high levels, and the valuation spread does contain information in terms of the future value premium, it is important to note that the relationship between current valuation spreads and future premium performance is too noisy to inform investment decisions aimed at timing the value premium. Thus, if you are considering altering your asset allocation based on current valuations, I recommend that you follow AQR’s Cliff Asness’ sage advice: If you are going to time the market, sin a little.
Important Disclosures
The information presented here is for educational purposes only and should not be construed as specific investment, accounting, legal, or tax advice. Certain information is based upon third party data which may become outdated or otherwise superseded without notice. Third party information is deemed to be reliable, but its accuracy and completeness cannot be guaranteed. By clicking on any of the links above, you acknowledge that they are solely for your convenience, and do not necessarily imply any affiliations, sponsorships, endorsements or representations whatsoever by us regarding third-party websites. We are not responsible for the content, availability or privacy policies of these sites, and shall not be responsible or liable for any information, opinions, advice, products or services available on or through them. The opinions expressed by featured author are their own and may not accurately reflect those of Buckingham Strategic Wealth® or Buckingham Strategic Partners®, collectively Buckingham Wealth Partners. LSR-21-149
About the Author: Larry Swedroe
—
Important Disclosures
For informational and educational purposes only and should not be construed as specific investment, accounting, legal, or tax advice. Certain information is deemed to be reliable, but its accuracy and completeness cannot be guaranteed. Third party information may become outdated or otherwise superseded without notice. Neither the Securities and Exchange Commission (SEC) nor any other federal or state agency has approved, determined the accuracy, or confirmed the adequacy of this article.
The views and opinions expressed herein are those of the author and do not necessarily reflect the views of Alpha Architect, its affiliates or its employees. Our full disclosures are available here. Definitions of common statistics used in our analysis are available here (towards the bottom).
Join thousands of other readers and subscribe to our blog.