Because of the complexity inherent to ETF trading in the secondary market, there are frequent misunderstandings about the relationship between the liquidity of the underlying securities and the liquidity of ETFs. Sometimes we hear that ETFs have excess liquidity to the underlying and at others, ETFs will have liquidity concerns. To get a better grasp on this relationship, we’ll hit on the basics of ETF trading, but for a detailed introduction to the ETF trading process please refer to Wes’ article on the topic here. Then we’ll take a look at the relationship between ETF and underlying security liquidity.(1)
How do ETFs Trade Anyway?
Let’s first establish who’s involved in the process:
- Investors – the institutions and individuals who are buying and selling the ETF in the open market.
- The Authorized Participant – is a special market maker that is allowed to trade in the create/redeem process with the Custodian.
- The Custodian – a large banking institution that holds the ETF assets for the investors in the ETF.
- ETF Sponsor – The financial firm that created, manages, and markets the ETF. (see here for how ETF launches work).
Quite frequently ETFs trade just as you would expect. A buyer and seller meet in the market and exchange cash for ETF shares, as can be seen here in figure 1:
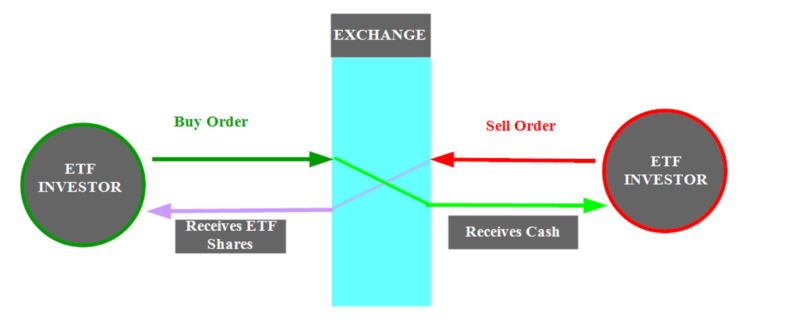
That is simple enough, and if you are new to ETF trading, that is probably where you stopped thinking about the details of ETF trading.
However, what if there are a lot more buyers of the ETF in the market than there are sellers? At the end of the day, an ETF is just a collection of stocks(2), and the ETFs price in the market cannot materially diverge from the price of a collection of securities. When there are more buyers than sellers in the market the price of the ETF will rise, but it can’t rise substantially above its holdings (Net Asset Value)(3). As the price of the ETF rises above the NAV a slight arbitrage opportunity will arise and the Authorized Participants can go out and buy the underlying securities of the ETF, deliver the underlying securities to the Custodian, and receive ETF shares to deliver to the Investors. Thus “Creating” new shares of the ETF.
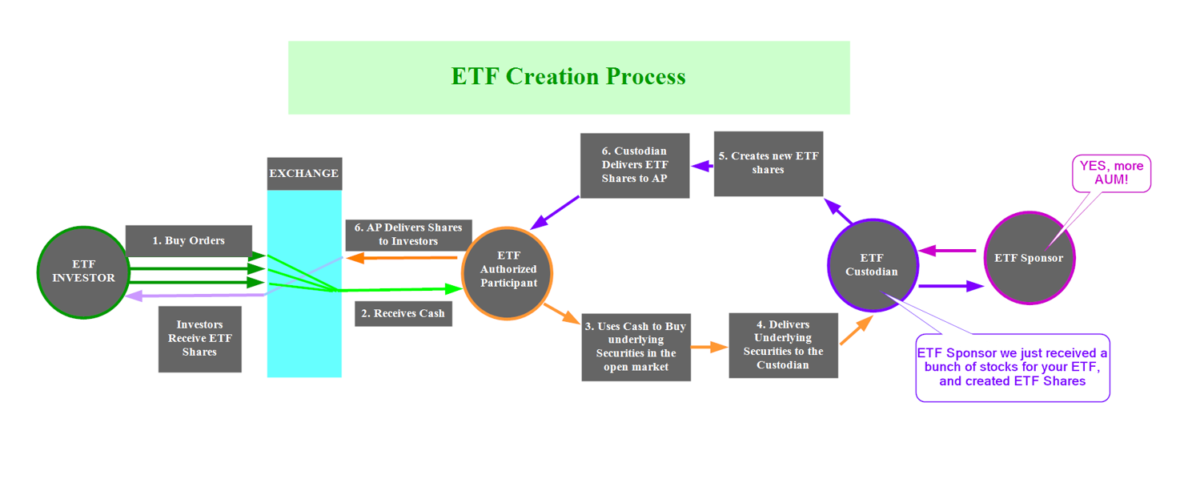
If nothing else, figure 2 makes it clear there are a lot of moving pieces behind the scenes on an ETF trade. The redemption process is exactly the same process, just instead of delivering the basket of underlying shares and receiving ETF shares, the AP delivers ETF shares and receives the basket of securities to sell.
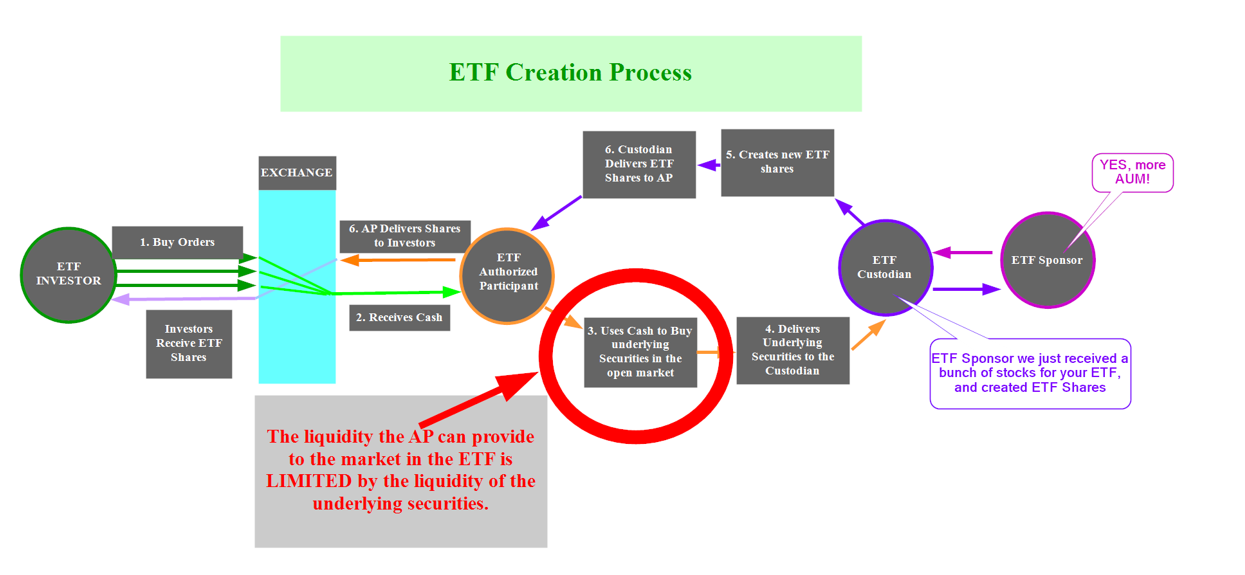
So what’s the scoop with ETF Liquidity?
In essence, ETFs have 2 layers of liquidity, the liquidity provided by the market, as we saw in figure 1, and the second layer of liquidity which is provided by the authorized participants seen in figure 2. But absent traders being in the market, the baseline driver of an ETF’s liquidity is dependent upon the ability of the AP to transact in the underlying securities.
What we occasionally see are ETF sponsors promoting the extra liquidity the ETF provides above their underlying holdings because of all the activity in the secondary market. For example, see below:
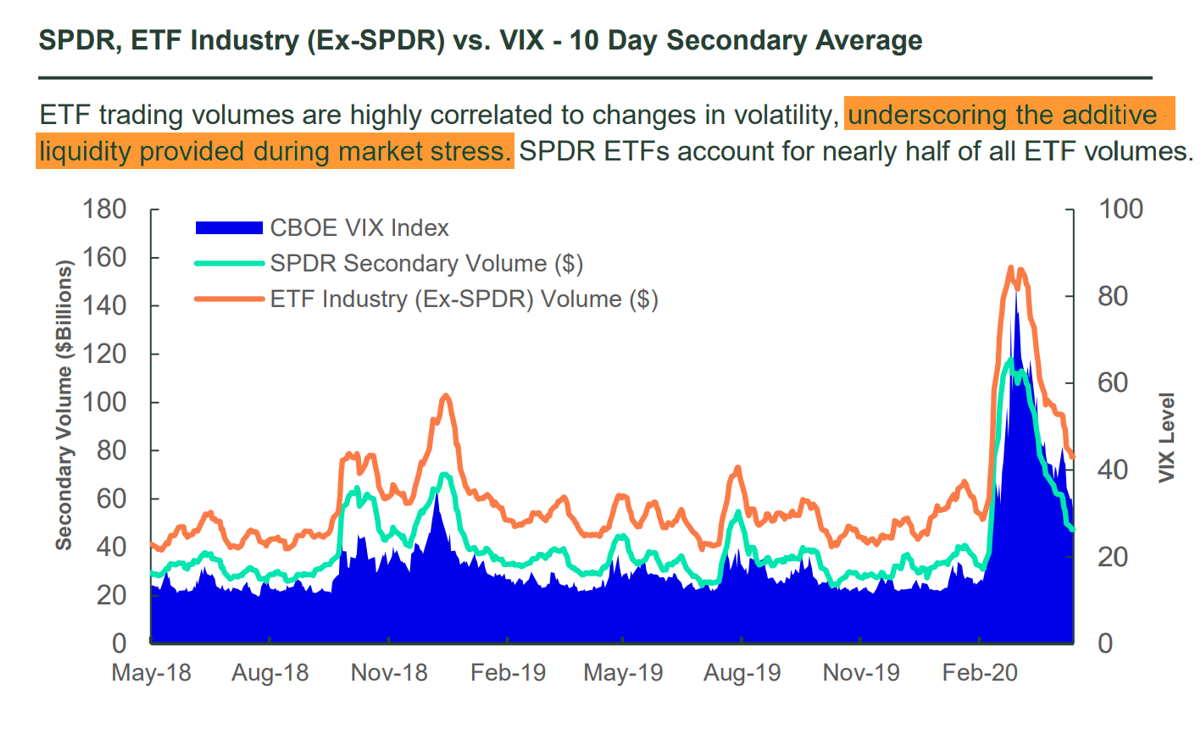
Is this extra ETF liquidity real or illusory? Could a shock to ETF liquidity propagate to underlying liquidity, or vice versa, and lead to the simultaneous evaporation of liquidity in both ETF and underlying markets during a market crisis, exposing investors to significant losses and the inability to sell their ETF shares?
Using daily data of DIAMONDS ETF on the Dow Jones Industrial Average and its underlying stocks from April 2002 to December 2016, Son Duy Pham, Ben Marshall, Nhut Nguyen, and Nuttawat Visaltanachoti, authors of the March 2021 study “Liquidity Spillover between ETFs and Their Constituents,” examined the magnitude and determinants of liquidity spillover between an ETF and its underlying portfolio. As of October 2020, DIAMONDS ETF had assets under management of $22.8 billion, making it one of the 50 largest ETFs. The authors used bid-ask spreads and the Amihud illiquidity ratio as liquidity proxies.
Following is a summary of their findings:
- There is a liquidity connection between the ETF and its underlying assets, suggesting the potential simultaneous liquidity dry-up in both markets.
- Arbitrage activity fuels liquidity spillover between the ETF and the underlying portfolio.
- DIAMONDS ETF had greater liquidity than its portfolio most of the time.
- Liquidity shocks can propagate to the underlying securities through the arbitrage channel. Thus, ETFs may increase the volatility of the securities in their baskets. However, liquidity shocks from underlying stocks have a more significant effect on ETF liquidity than in reverse.
- Liquidity spillover increases during a market crisis and positively relates to market volatility and funding constraints—during market turmoil, the ETF market is more vulnerable to liquidity shocks from the underlying market than vice versa.
- Stocks with high volatility and low trading activity exhibit higher liquidity spillover.
- The past variation of ETF liquidity is the most critical contributor to the fluctuation of underlying liquidity and vice versa.
- A rise in the default spread increases the liquidity spillover.
Their findings led Pham, Marshall, Nguyen, and Visaltanachoti to conclude:
“Liquidity spillover is significant between ETF and the underlying stock portfolio, implying that ETF liquidity is illusionary.”
They added:
“Furthermore, it intensifies dramatically during the market crisis and positively relates to market volatility and funding constraints. Finally, liquidity spillover varies proportionally with ETF arbitrage activity and tends to be lower when short sales constraints exist.”
Thus, short-selling constraints can reduce the magnitude of liquidity spillover.
For ETF investors the most important takeaway is that when “push comes to shove,” the underlying securities will set the baseline liquidity of the ETF you are holding. There is the potential to get some additional liquidity thanks to investor/trading activity in the ETF, but it is likely that this liquidity will dry up when you most want it to be there.
DISCLOSURES
Important Disclosure: The information contained in this article is for educational purposes only and should not be construed as specific investment, legal, tax, or accounting advice. Certain information contained in this article are based upon third party information and deemed to be reliable, but its accuracy and completeness cannot be guaranteed. By clicking on any of the third-party links above, you acknowledge that they are solely for your convenience, and do not necessarily imply any affiliations, sponsorships, endorsements, or representation whatsoever by us regarding third party websites. We are not responsible for the content, availability, or privacy policies, of these sites, and shall not be responsible or liable for any information, opinions, advice, products, or services available on or through them. LSR-21-51
About the Author: Larry Swedroe
—
Important Disclosures
For informational and educational purposes only and should not be construed as specific investment, accounting, legal, or tax advice. Certain information is deemed to be reliable, but its accuracy and completeness cannot be guaranteed. Third party information may become outdated or otherwise superseded without notice. Neither the Securities and Exchange Commission (SEC) nor any other federal or state agency has approved, determined the accuracy, or confirmed the adequacy of this article.
The views and opinions expressed herein are those of the author and do not necessarily reflect the views of Alpha Architect, its affiliates or its employees. Our full disclosures are available here. Definitions of common statistics used in our analysis are available here (towards the bottom).
Join thousands of other readers and subscribe to our blog.