Hendrik Bessembinder published a fascinating paper, which finds that nearly all publicly traded stocks in the U.S. — if held as buy and hold investments — underperform Treasury bills. This finding is incredibly surprising and interesting. Of course, when bold claims are made, they tend to attract a lot of attention. For example, Alpha Architect has covered the fascinating Bessembinder research here and here, and the research has been cited in the media across various outlets.
Due to the surprising headline that treasury bills seemingly outperform stocks, practitioners are starting to ask:
Should I invest in individual stocks?
The short answer is a resounding “yes.” And here’s why: the Bessembinder study does not consider that individual stocks are generally bought and sold and the holding period is rarely “forever.” Interestingly enough, when one allows for holding periods that aren’t forever, stocks become an attractive alternative to Treasury Bills (for those who can bear some risk). (See Jack’s piece for a reconciliation of the Bessembinder study and factor portfolios).
Some Background
First, an obvious point: your return to investing in a stock will depend on when you buy, when you sell, and your holding period.
Let us begin by thinking logically about why purchase and sale dates as well as holding periods matter with regard to performance (i.e., return). Mathematically, a stock’s return can be formulated with the following equation:
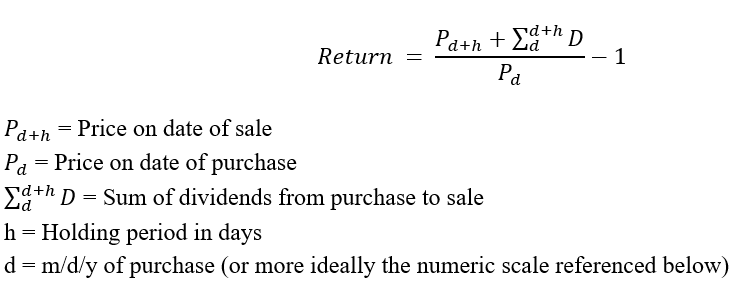
One of the few certainties in life is that stock prices will fluctuate. Stock prices fluctuate second to second but for simplicity, and due to the availability of long-run data, we will discuss daily fluctuations, but the logic still holds for intra-day fluctuations. Due to these day-to-day fluctuations, the price of a stock is very likely to be different on any given day. From the equation above, it is easy to see that different prices will generate different returns. If d equals 12/31/1925 (1) versus 1/9/1926 (10), the market price is likely to be different, generating a different return, ceteris paribus. If h equals 30 days versus 45 days, the market price is likely to be different, generating a different return, ceteris paribus. Clearly, the return generated by any stock is dependent upon the date that it is purchased and sold. Invariably, different purchase and sale dates will almost certainly provide different returns due to different prices. In other words, that prices vary day to day is pretty much a guarantee.
Why does this matter?
Well, the performance results presented in the Bessembinder study conclude that the vast majority of individual stocks underperform Treasury bills, but this is only valid over a specific set of performance intervals. The study “report[s] on actual buy-and-hold returns to individual CRSP common stocks at the monthly, annual, decade, and lifetime horizons … When studying periods longer than one month, I create buy-and-hold returns by linking monthly gross (one plus) returns … [annual returns are] computed on a calendar year … The non-overlapping decades are defined as July 1926 to December 1936, January 1937 to December 1946, January 1947 to December 1956, etc.”
Due to the strict assumptions embedded in the study regarding performance intervals, there are two elements of the study that limit the study’s applicability to practitioners and should, therefore, not dissuade investment in individual stocks.
- Monthly return data from CRSP assumes d is always equal to the prior calendar month end. CRSP also assumes d + h is always equal to the current month end. This means that only 12 out of more than 250 potential days in any given year are utilized to create the return figures. Therefore, only a fraction of the market prices of any given stock, in any given year, are considered. Practitioners are not limited to purchasing or selling only on these 12 dates. Instead, practitioners are free to purchase and sell on nearly any day of their choosing. As was established above, different purchase and sale dates are likely to offer different prices generating different returns. The utilization of only certain dates, and therefore certain market prices, creates a bias with regard to the performance reported.
- Monthly, annual, and decade horizons with prespecified purchase and sale dates create roughly a dozen and a half holding periods. Calendar month end horizons have holding periods ranging from 27-34 days; calendar annual end horizons have holding periods ranging from 364-368 days; and calendar end decade horizons have holding periods ranging from 3650-3654 days (3837 days for the 06/30/1926 to 12/31/1936 period). These are only a small fraction of the potential holding periods available to practitioners. Practitioners can have holding periods of 1 day, 2 days, 3 days, … N days (i.e., total number of days on the exchange). As was established above, different holding periods (assuming the same purchase date) will result in different sale dates, likely offering different sale prices and generating different returns. Again, the utilization of only certain holding periods, and therefore certain market prices, creates a bias with regard to the performance reported.
What Happens if We Allow Active Management?
To have a truly comprehensive view of the performance of individual stocks versus bills, we would need to assess all possible purchase and sale dates, as well as all holding periods. A robust approach to performance evaluation would be to rely on the daily return files from CRSP, create a numeric scale of dates from 1 (i.e., 12/31/1925 – first date in CRSP) to L (i.e., last date of the researcher’s time frame under observation), and then test all purchase and sales dates utilizing all rolling holding periods from 1 day to N days. This approach would provide a complete view of all of the historical returns generated by an individual stock by incorporating all purchase and sale dates over all the holding periods.
Without a truly comprehensive study addressing all possible purchase and sale dates, there is less reason to be deterred from investing in individual stocks, unless your holding period for a stock position is ‘forever.'(1).
A final thought on behavioral errors since they are so often associated with individual stocks. To quote Richard Thaler and Robert Shiller (both Nobel laureates):
“individual investors and money managers persist in their belief that they are endowed with more and better information than others, and that they can profit by picking stocks.”
Richard Thaler & Robert Shiller, New York Times, March 30, 1997
The problem with this statement is that more or better information is not the secret sauce. Warren Buffett was unlikely to have had more or better information than others while he was running the Buffett Partnership Ltd. (BPL) and producing the best returns of his career. Omaha, Nebraska in the late 1950s and 1960s seems unlikely to have been a hub for valuable financial information and Buffett was a relative novice considering his ripe old age of 27-39. He was even discredited/ridiculed by Wall Street veterans prior to starting BPL(2). Walter Schloss certainly did not have more or better information while working in what some referred to as a closet and utilizing only the publicly available Value Line Investment Survey. What they had was better/sound judgment. Their judgment of what information was relevant and how to use that information was what set them apart. Their education on investing was likely to have provided the necessary foundation required for sound judgment.
To quote their teacher, Ben Graham,
“Knowledge is only one ingredient on arriving at a stock’s proper price. The other ingredient, fully as important as information, is sound judgment.”
Graham, Benjamin. 1974. “The Decade 1965-1974: Its Significance for Financial Analysts”
References[+]
| ↑1 | Decade long holding periods and lifetime holding periods are inherently irrational, to begin with. This is due to the simple fact that management, the most important aspect of a firm’s success because their role as the capital allocators, is likely to change numerous times over these long periods of time. Unless an investor is able to control or significantly influence management over his/her entire holding period, long holding periods are best avoided in the first place. |
|---|---|
| ↑2 | “[Graham and Newman] been working here for thirty years building up this business, and all they would have had to run it was this kid named Warren Buffett. He’s the best they could come up with. And who’d want to ride with him?” – Lou Green from The Snowball by Alice Schroeder |
About the Author: Lloyd Everhart
—
Important Disclosures
For informational and educational purposes only and should not be construed as specific investment, accounting, legal, or tax advice. Certain information is deemed to be reliable, but its accuracy and completeness cannot be guaranteed. Third party information may become outdated or otherwise superseded without notice. Neither the Securities and Exchange Commission (SEC) nor any other federal or state agency has approved, determined the accuracy, or confirmed the adequacy of this article.
The views and opinions expressed herein are those of the author and do not necessarily reflect the views of Alpha Architect, its affiliates or its employees. Our full disclosures are available here. Definitions of common statistics used in our analysis are available here (towards the bottom).
Join thousands of other readers and subscribe to our blog.