Academic research has found that factor premiums are both time-varying and dependent on the economic cycle. For example, the authors of the 2017 study “Fama-French Factors and Business Cycles” examined the behavior of six Fama-French factors—market beta (MKT), size (SMB), value (HML), momentum (MOM), investment (CMA), and profitability (RMW)—across business cycles, splitting them into four separate stages: recession, early-stage recovery, late-stage recovery, and very late-stage recovery. Their data, including the results shown in the following table, covered the period April 1953 through September 2015.
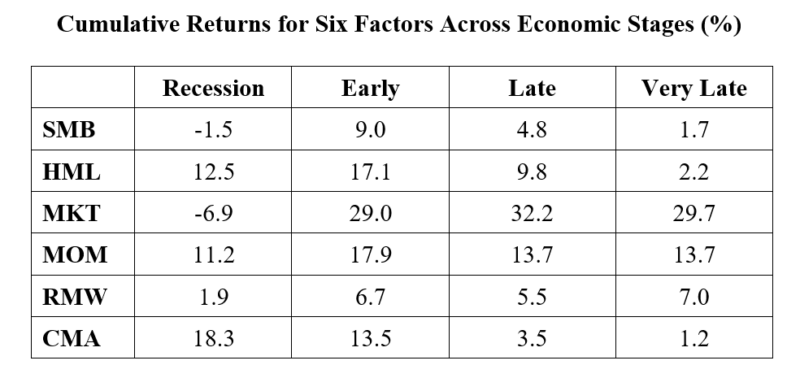
As you can see, factor premiums vary and are regime-dependent. That, of course, makes timing them tempting. For example, the authors of the 2021 study, “How Do Factor Premia Vary Over Time? A Century of Evidence,” examined four prominent factors across six asset classes over a century and found meaningful time variation in factor risk-adjusted returns. However, the time variation in returns appeared to be unrelated to macroeconomic risks. They also found that attempts to capture the time variation in factor premiums through various timing strategies were not likely to overcome implementation frictions. In other words, strategic diversification turns out to be a tough benchmark to beat, while tactical value timing can reduce diversification and detract from the performance of a multi-style strategy that already includes value.
Providing further evidence of the difficulty of timing factor premiums is the 2018 study “Factor Exposure Variation and Mutual Fund Performance.” The authors examined whether actively managed mutual funds were successful at timing factor premiums (net of fees) over the period late 2000 through 2016. They found that while factor timing activity is persistent, risk factor timing is associated with future fund underperformance. For example, a portfolio of the 20 percent of funds with the highest timing indicator underperformed a portfolio of the 20 percent of funds with the lowest timing indicator by a risk-adjusted 134 basis points per year, with statistical significance at the 1 percent confidence level (t-stat: 3.3).
Summarizing their results, they concluded:
“Our results do not support the hypothesis that deviations in risk factor exposures are a signal of skill and we recommend that investors should resist the temptation to invest in funds that intentionally or coincidentally vary their exposure to risk factors over time.”
Michael Aked of Research Affiliates took another look at the issue in his April 2021 study, “Factor Timing: Keep It Simple.” He evaluated three factor-timing strategies—a factor’s historical return, the economic stage, and a factor’s discount and momentum—using only data that was available at the time. A factor portfolio’s discount was calculated as its current valuation (using the relationship of price to various fundamental measures of the component equities) relative to its average historical valuation. A factor’s momentum was the performance of the factor over the previous 12 months.
In each case, the strategy was constructed out of sample using data only available at the time of the specific sample period. He examined eight factors (market, value, investment, size, illiquidity, profitability, low beta, and momentum) across six regions (Australia, United States, Europe, United Kingdom, Japan, and the emerging markets). Data for the U.S. began in May 1969, for Europe in April 1996, for Australia in May 2001, for Japan in October 2001, for the U.K. in December 2001, and for emerging markets in May 2003.
His findings led him to conclude:
- The strategy of using a factor’s historical performance as a guide to the future is nearly worthless.
- Although a factor’s return changes throughout the business cycle, the ability to predict economic regimes and alter factor allocations accordingly produces less successful results despite being intuitively pleasing.
- Employing a factor’s discount (the spread in valuations) and momentum is the most effective tool for determining how to vary a factor’s exposure through time.
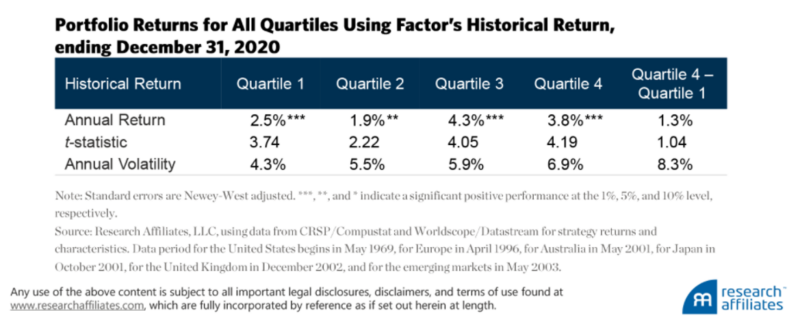
The Statistical significance of each quartile’s return should not be a surprise, because the factors we included in our analysis are the best known and most respected by investors in the factor-investing space. The return difference between the top and bottom quartile, Quartile 5 – Quartile 1, is not significant, however, meaning the annual return difference of 1.3% between these two quartiles can arise from randomness. We thus conclude that factor timing based on the historical returns of well-known factors is not an overly compelling strategy.
Michael Aked – Factor Timing: Keep It Simple
The finding that timing based on the state of the economy does not produce successful results should not be surprising because the markets are forward-looking. Thus, whatever is known about the economy is already incorporated into security prices. If the state of the economy does not produce successful results, what does explain the cycles we experience in factors? For example, while the value factor has a long-term premium of about 3 percent, it had a -20 percent annual return over the 1998-1999 period followed by a 15 percent annual return over the 2000-2006 period. David Blitz sought the answer to that question in his September 2021 paper, “The Quant Cycle.”
Explaining Cycles
Blitz’s analysis focused on four factors frequently targeted by investors: value, quality, momentum, and low risk. His data sample spanned the period July 1963 to December 2020, the longest for which data was available. He confirmed previous findings that traditional business cycle indicators do not capture much of the large cyclical variation in factor returns and that major turning points of factors seem to be caused by abrupt changes in investor sentiment.
“Investor sentiment” refers to the general mood investors exhibit toward a particular market or asset. Positive and negative investor sentiment each occur about 50 percent of the time on average. Sentiment can be an important determinant of investment performance because investors who exhibit relatively high sentiment tend to be overconfident and engage in excessive trading, resulting in subpar investment performance because they are trading on “noise” and emotions. Such activity can lead to mispricing. Eventually, any mispricing would be corrected when the fundamentals are revealed, making investor sentiment a contrarian predictor of stock market returns.
Examples of times when investor sentiment ran high are the 1968-69 electronics bubble, the biotech bubble of the 1980s and the dot-com bubble of the late 1990s. Sentiment fell sharply, however, after the 1961 crash of growth stocks, in the mid-1970s during the oil embargo and in the crash of 2008.
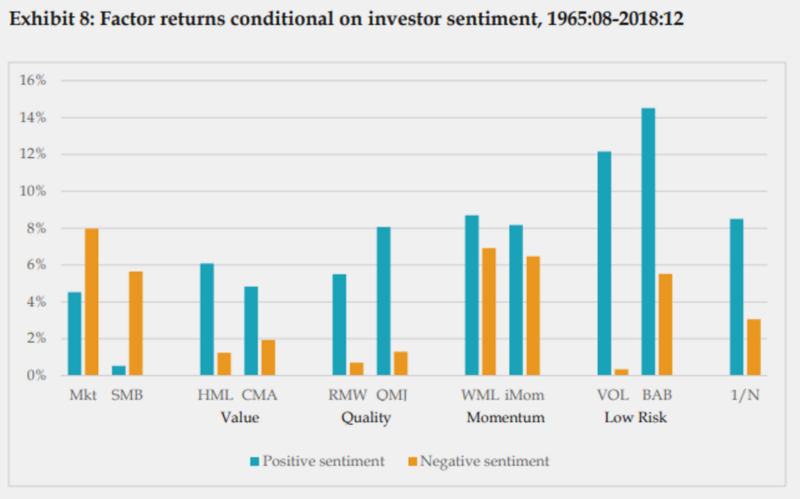
Malcolm Baker and Jeffrey Wurgler constructed an investor sentiment index based on five metrics: the value-weighted dividend premium (the difference between the average market-to-book ratio of dividend payers and nonpayers), the first day returns on initial public offerings (IPOs), IPO volume, the closed-end fund discount and the equity share in new issues. Originally, the Baker-Wurgler index included a sixth metric; however, the NYSE turnover ratio was dropped in the newest update. (Data is available at Wurgler’s New York University web page.) Among their findings was that factor returns are much higher when sentiment is positive than when it is negative. The one exception was momentum, which was robust to investor sentiment. Thus, sentiment might help explain factor performance, while economic factors might fail to do so.
Blitz began by noting:
“Perhaps it is so difficult to establish a relation between macroeconomic risks and factor premiums because the notion that factor premiums reward investors for bearing such risks is flawed. For instance, the major turning points in the factor cycle do not appear to coincide with the release of major macroeconomic news, but seem to be related to changes in investor sentiment. In retrospect it is unclear what triggered these sentiment changes, and it seems that they might as well have happened at an earlier or later point in time. Apart from that there is of course also the entire behavioral finance literature, which links factor premiums to psychological biases in the human decision-making process.”
Blitz then inferred:
“a Quant Cycle directly from factor returns, which consists of a normal stage that is interrupted by occasional drawdowns of the value factor and subsequent reversals.”
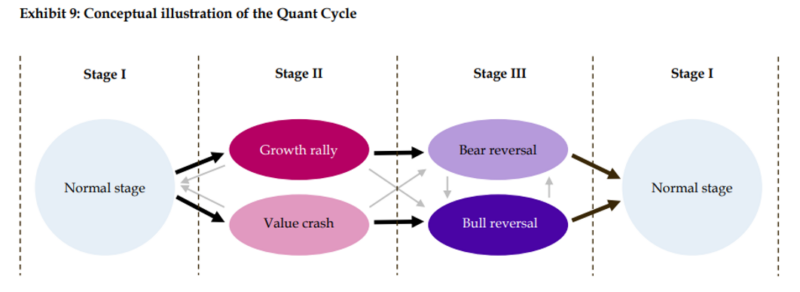
He noted that value factor drawdowns can occur in bullish environments due to growth rallies and in bearish environments due to crashes of value stocks. Examples of growth rallies are the Nifty Fifty era in the early 1970s, during which investors flocked into blue-chip stocks such as Xerox, Polaroid, Coca-Cola, McDonald’s, and IBM; the end of the 1980s, powered by the health care, biotech, and beverages industries; and the infamous tech bubble in the late 1990s. Each of these events was followed by bear reversals for growth stocks. The next growth rally, from 2017 to 2020, was driven by technology stocks such as FANMAG (Facebook, Amazon, Netflix, Microsoft, Apple, and Google, now trading as Alphabet) and Tesla, not by poor earnings of value companies. Value crashes can also occur for economic reasons, such as during the Great Financial Crisis when financial stocks, which tend to be value stocks, crashed.
For the reversals, Blitz also distinguished between bullish and bearish subvariants:
“Empirically we show that our simple 3-stage model captures a considerable amount of time variation in factor returns.” He added: “If the source of factor premiums is indeed behavioral, then this would explain why the Baker & Wurgler investor sentiment index appears more effective at distinguishing between high and low factor returns. However, even this indicator is only able to pick up a small portion of the much larger time variation in factor returns.”
Blitz concluded:
“Investors should focus on better understanding the quant cycle as implied by factors themselves, rather than adhering to traditional frameworks which, at best, have a weak relation with actual factor returns.”
Following are his main findings:
- During the normal stage, all factors showed solid positive average returns, typically even above their long-term average premiums. This stage prevailed about two-thirds of the time.
- The value factor experiences a major drawdown about once every 10 years. The cause of these drawdowns is either a rally of growth stocks (in a bullish environment) or a crash of value stocks (in a bearish environment). These periods also tend to be difficult for the low risk factor. However, large losses on the value factor are typically mirrored by similar-sized gains on the momentum factor—illustrating why the value-momentum combination is at the heart of many quant approaches because the two factors diversify well with each other during extreme times (though this did not occur in the most recent value drawdown).
- Immediately following a growth rally or value crash, we typically observe a strong reversal. Here it is even more important to distinguish between bullish and bearish variants because their impact on factor returns is very different.
- A bear reversal is characterized by a crash of the growth stocks that rallied during the previous stage, resulting in a strong rebound of the value factor. An example of this is the burst of the tech bubble in 2000-2002, during which the Nasdaq lost over three-quarters of its value.
- A bull reversal is characterized by a rebound of stocks that experienced the biggest losses, resulting in large negative returns for the momentum factor. An example of this is the relief rally of 2009, when cheap financials that were beaten down during the Global Financial Crisis made a strong recovery.
- Bear reversals tend to be great for multifactor investors, with large positive returns on all factors, but bull reversals are much more challenging, with large negative returns for most factors except value.
- After the reversal stage, factors tend to revert to normal mode, which is the stage that prevails about two-thirds of the time.
- Growth rallies, value crashes and reversals tend to be short, resulting in a probability of about 50 percent for moving to the next stage within a year—patience is rewarded.
- The presample period, 1929-63, showed similar results for the value and momentum factors. Data for the other factors was not available.
His findings led Blitz to conclude that while the Baker and Wurgler investor sentiment index is more effective at distinguishing between different regimes for factor returns, it is still of limited practical use, as factors tend to follow their own cycles
Summary
Blitz’s model is explanatory, and although it shows that there are huge potential returns to be made with factor timing, it is silent on how to do that. With that said, if factors are following their own sentiment-driven cycle, it makes sense to approach factor timing by looking at metrics that are directly related to factors (like factor momentum and factor valuations) instead of trying to time factors with macroeconomic indicators, such as business cycle, inflation or interest rate.
Investor Takeaways
The main takeaway is that because factor timing is a strategy “fraught with opportunity,” investors should accept the fact that all risk strategies go through extended periods of poor (and unforecastable) periods of poor performance. As Blitz noted: “Even though investor sentiment may be more effective than the other metrics, its discriminatory power remains limited because expected factor premiums are still positive in all instances.” Thus, the prudent strategy is one of diversifying across many unique sources of risk so that not all of your risk eggs end up in the wrong basket at the wrong time.
Another takeaway is that if you are going to try to time factors, the research shows that employing momentum strategies has provided the most effective solutions. For example, the authors of the 2019 paper “Factor Momentum Everywhere,” the 2020 paper “Factor Momentum and the Momentum Factor” and the 2021 paper “Momentum? What Momentum?” found that momentum in individual stock returns emanates from momentum in factor returns—a factor’s prior returns are informative about its future returns.
A third takeaway is that valuation spreads do provide information on future returns, as the authors of the 2019 study “Value Return Predictability Across Asset Classes and Commonalities in Risk Premia” found. They explained: “Returns to value strategies in individual equities, industries, commodities, currencies, global government bonds, and global stock indexes are predictable in the time series by their respective value spreads.” The authors of the 2018 study “Value Timing: Risk and Return Across Asset Classes” provided further evidence that valuation spreads provide information. They found: “Returns to value strategies in individual equities, commodities, currencies, global government bonds and stock indexes are predictable by the value spread. … In all asset classes, a standard deviation increase in the value spread predicts an increase in expected value return in the same order of magnitude (or more) as the unconditional value premium.” Their findings were confirmed by Thiago de Oliveira Souza, author of the 2018 study “Macro-Finance and Factor Timing: Time-Varying Factor Risk and Price of Risk Premiums.” He found that increases in the cross-sectional book-to-market spreads significantly forecast increases in one-month-ahead premiums for all except the profitability factor. And Souza’s findings were consistent with those of Adam Zaremba and Mehmet Umutlu, authors of the March 2019 study “Strategies Can Be Expensive Too! The Value Spread and Asset Allocation in Global Equity Markets,” who found that the value spread is a powerful and robust predictor of strategy returns.
The bottom line is that being a successful investor requires acknowledging that all risky assets experience long periods of underperformance. Thus, patience and discipline are the necessary ingredients for success. As Buffett noted, when it comes to investing, temperament trumps intelligence.
Important Disclosures:
The article above is for informational and educational purposes only and should not be construed as specific investment, accounting, legal, or tax advice. Certain information is based upon third party information which may become outdated or otherwise superseded without notice. Third party information is deemed to be reliable, but its accuracy and completeness cannot be guaranteed. By clicking on any of the links above, you acknowledge that they are solely for your convenience, and do not necessarily imply any affiliations, sponsorships, endorsements or representations whatsoever by us regarding third-party websites. We are not responsible for the content, availability or privacy policies of these sites, and shall not be responsible or liable for any information, opinions, advice, products or services available on or through them. The opinions expressed by featured authors are their own and may not accurately reflect those of the Buckingham Strategic Wealth® or Buckingham Strategic Partners®, collectively Buckingham Wealth Partners. LSR-21-166
About the Author: Larry Swedroe
—
Important Disclosures
For informational and educational purposes only and should not be construed as specific investment, accounting, legal, or tax advice. Certain information is deemed to be reliable, but its accuracy and completeness cannot be guaranteed. Third party information may become outdated or otherwise superseded without notice. Neither the Securities and Exchange Commission (SEC) nor any other federal or state agency has approved, determined the accuracy, or confirmed the adequacy of this article.
The views and opinions expressed herein are those of the author and do not necessarily reflect the views of Alpha Architect, its affiliates or its employees. Our full disclosures are available here. Definitions of common statistics used in our analysis are available here (towards the bottom).
Join thousands of other readers and subscribe to our blog.