Market commentators sometimes suggest that the equity ETF market is just a bunch of “index funds” that all do essentially the same thing: deliver undifferentiated stock market exposure.
How true is that statement? Fortunately, we can test the hypothesis that the ETF market is roughly a few thousand different ways to capture the same basic risk/returns. To do so, we leverage our Portfolio Architect tool to quantify the active share of all US equity ETFs against the S&P 500 index (the king of indexes).
Active share is the percentage of a portfolio’s stock holdings that differ from its benchmark index (in this case, the S&P 500). The measure is based on the weightings of securities in a portfolio compared with those of its benchmark and can be used as a measure of the degree of a portfolio’s active management. An active share of 0, would imply there is a 0% difference between a given ETF and the SP500. An active share of 100 would imply there is a 100% difference in holdings/weights between a given ETF and the SP500. And then you have everything in between.
As a general rule of thumb, we consider any strategy with an active share of less than 30% to be a ‘closet index’, which refers to a strategy that is effectively the same as the underlying index it seeks to track.
Here is the distribution of active shares across the 1814 US Exchange Traded Equity ETFs we track in our database against SPY (what we use as the SP500 holdings benchmark).
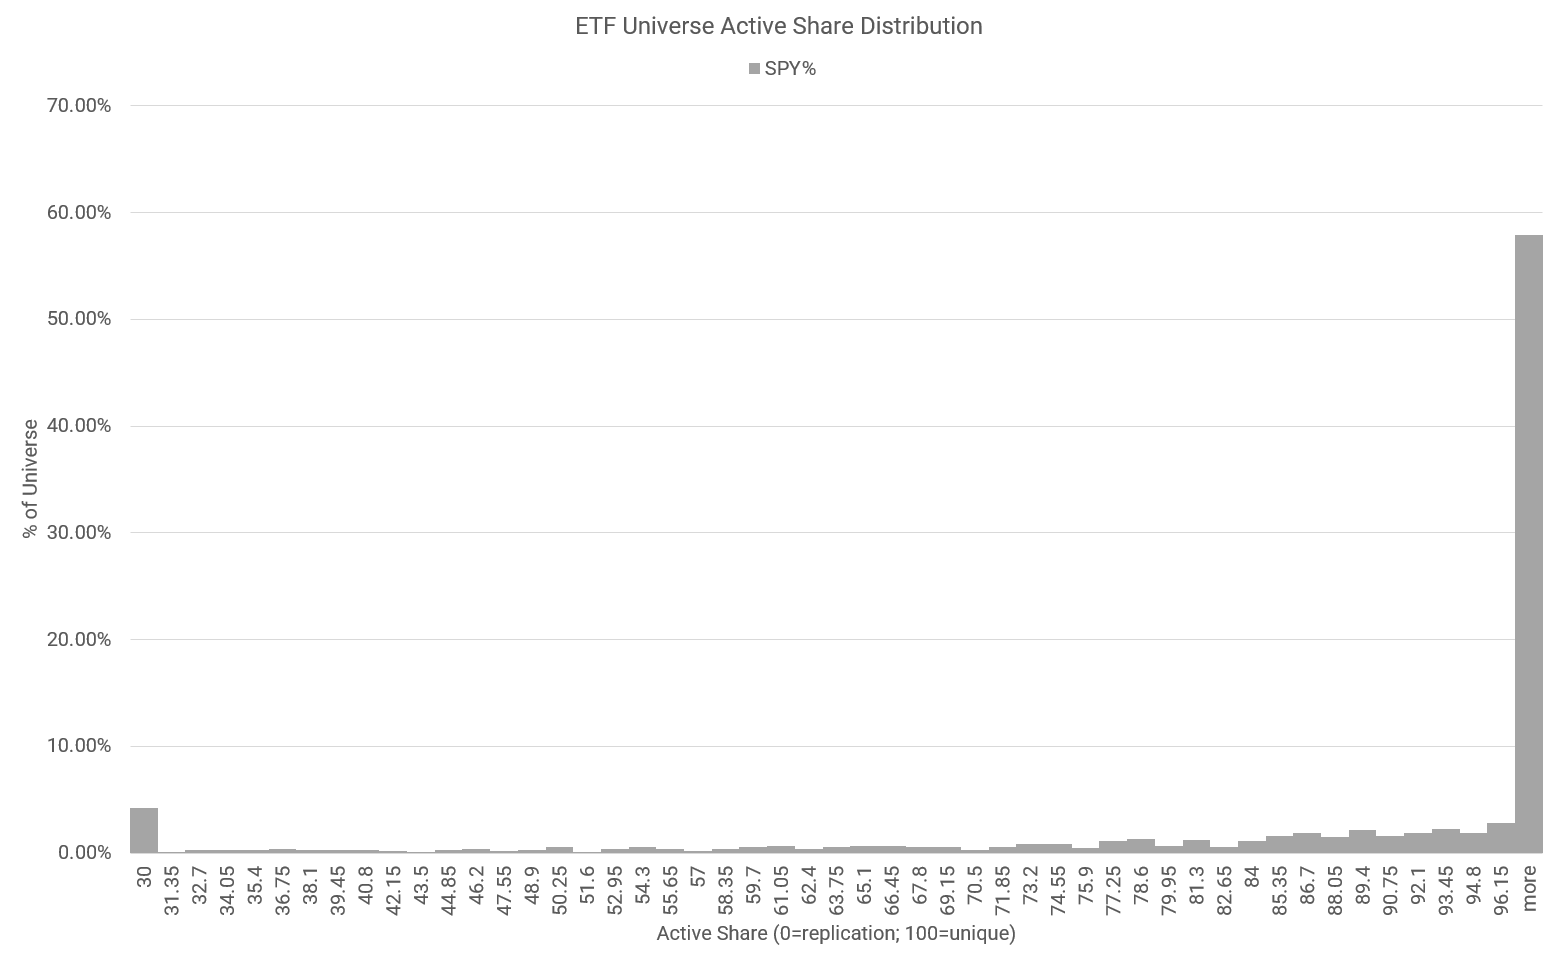
Key Points:
- A bit over 4% of all funds are S&P 500 closet-trackers. That’s a lot of clones — no doubt!
- Nearly 60% of all funds have nothing to do with the S&P 500.
- There is a lot of differentiation in the ETF market. And that’s healthy!
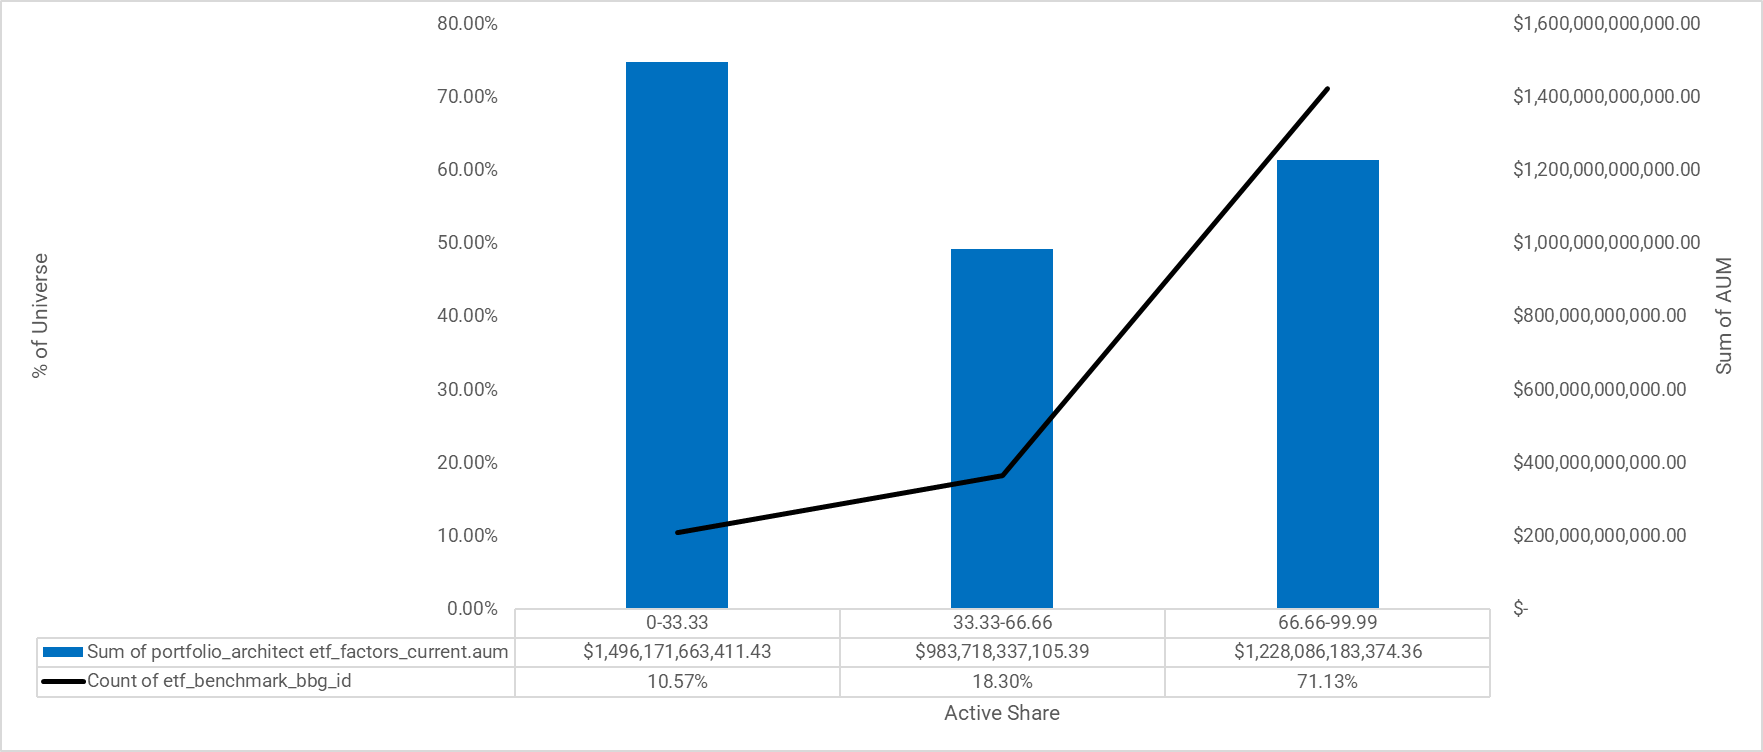
More Charts
Here we look at US Exchange Traded ETFs that only traffic in US stocks.
The left axis is the % of the universe and the right access is the sum of the AUM allocated to a given active share bucket.
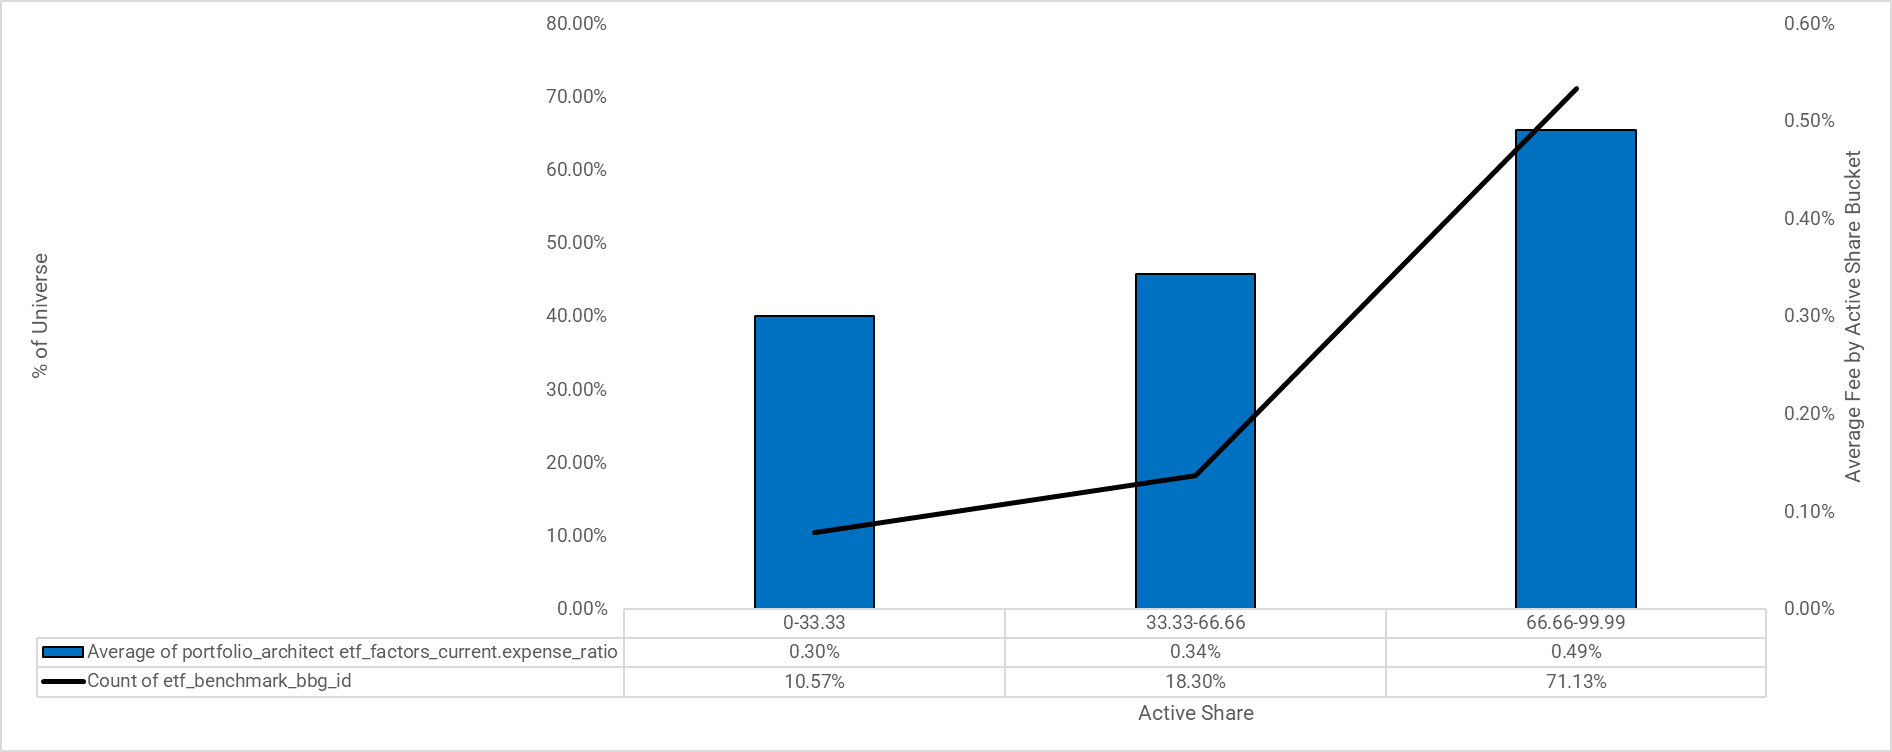
We do the same thing but with expense ratios:

About the Author: Wesley Gray, PhD
—
Important Disclosures
For informational and educational purposes only and should not be construed as specific investment, accounting, legal, or tax advice. Certain information is deemed to be reliable, but its accuracy and completeness cannot be guaranteed. Third party information may become outdated or otherwise superseded without notice. Neither the Securities and Exchange Commission (SEC) nor any other federal or state agency has approved, determined the accuracy, or confirmed the adequacy of this article.
The views and opinions expressed herein are those of the author and do not necessarily reflect the views of Alpha Architect, its affiliates or its employees. Our full disclosures are available here. Definitions of common statistics used in our analysis are available here (towards the bottom).
Join thousands of other readers and subscribe to our blog.