In order for investors to determine which of the hundreds of factors in what John Cochrane famously called the “zoo of factors” were worthy of investment, Andrew Berkin and I set out seven criteria in our book “Your Complete Guide to Factor-based Investing.” For a factor to be considered, it must meet all the following tests. To start, it must provide explanatory power to portfolio returns (it’s a unique factor) and have delivered a premium (higher returns). Additionally, the premium must also meet the following five criteria:
- Persistent — It holds across long periods of time and different economic regimes.
- Pervasive — It holds across countries, regions, sectors, and even asset classes.
- Robust — It holds for various definitions (for example, there is a value premium whether it is measured by price-to-book, earnings, cash flow or sales).
- Investable — It holds up not just on paper but also after considering actual implementation issues, such as trading costs.
- Intuitive — There are logical risk-based or behavioral-based explanations for its premium and why it should continue to exist.
Fortunately, of the hundreds of factors in the zoo, only a handful of equity factors met all the criteria: market beta, size, value, profitability/quality, and momentum.
Yigit Atilgan, K. Ozgur Demirtas, A. Doruk Gunaydin, and Imra Kirli contribute to the momentum literature, providing a test of pervasiveness, with their study “Momentum and Downside Risk in Emerging Markets” published in the special 2022 Emerging Markets issue of The Journal of Portfolio Management. They analyzed the performance of momentum across the equity markets of 29 emerging countries (Argentina, Bangladesh, Brazil, Chile, China, Colombia, Czech Republic, Egypt, Greece, Hungary, India, Indonesia, Malaysia, Mexico, Morocco, Nigeria, Pakistan, Peru, Philippines, Poland, Romania, Russia, South Africa, South Korea, Sri Lanka, Taiwan, Thailand, Turkey, and Vietnam). Their sample period began in 1988 for 11 countries, and before or in 1992 for 22 countries. There were only two countries for which the sample period began after 1996—Vietnam (2007) and Nigeria (2010). The sample ended in 2019 for all markets and contained 22,292 unique firms. To construct their momentum portfolios, they followed a procedure that is standard in the literature: ranking stocks according to their 11-month cumulative returns from 12 months before to one month before the formation date.
Following is a summary of their findings:
- Momentum produced significantly positive returns in an overwhelming majority of emerging markets.
- The average return of the winners-minus-losers (WML) portfolio was significantly positive at the 5 percent confidence level in 25 countries and at the 10 percent level in another. In the remaining countries, the strategy produced positive but insignificant returns.
- The positive returns to the momentum strategy were not driven by sharp return jumps or drops at the extreme deciles—there was generally a uniformly increasing pattern in returns moving from loser deciles to winner deciles.
- In 21 out of 26 emerging markets for which the strategy generated significant returns, the winner decile was associated with significantly positive returns, while the returns to the loser decile were statistically insignificant—the significance of the WML portfolio returns tends to be driven by the long leg rather than the short leg (important for long-only investors).
Equal Weighted Momentum Portfolio Returns
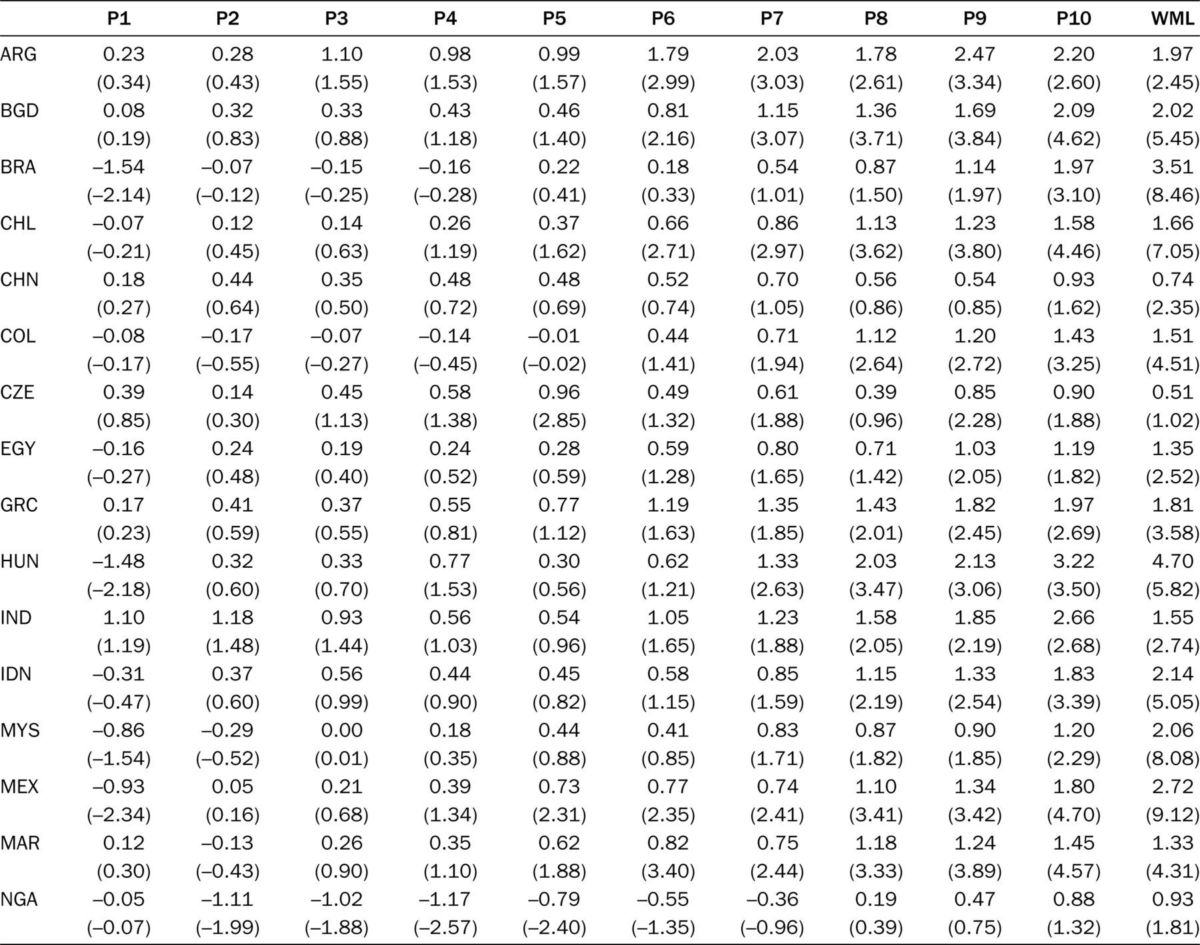
The results are hypothetical results and are NOT an indicator of future results and do NOT represent returns that any investor actually attained. Indexes are unmanaged, do not reflect management or trading fees, and one cannot invest directly in an index.
Because momentum results could be driven by the higher weights that stocks of small firms acquire in equal-weighted portfolios (it is costlier to arbitrage away mispricing associated with such securities due to stronger market frictions such as transaction costs and short sales constraints), they also reported results for value-weighted portfolios (see table below). Modifying the weighting scheme did not have a substantial impact on the WML portfolio returns—the average return of the momentum strategy was significantly positive at the 5 percent level in 23 countries and at the 10 percent level in another. In addition, the winner (loser) decile generated significantly positive (insignificant) returns in 18 out of 24 emerging markets in which the momentum effect was observed. And in only two countries did the market portfolio provide higher returns than the WML portfolio.
Value-Weighted Momentum Portfolio Returns
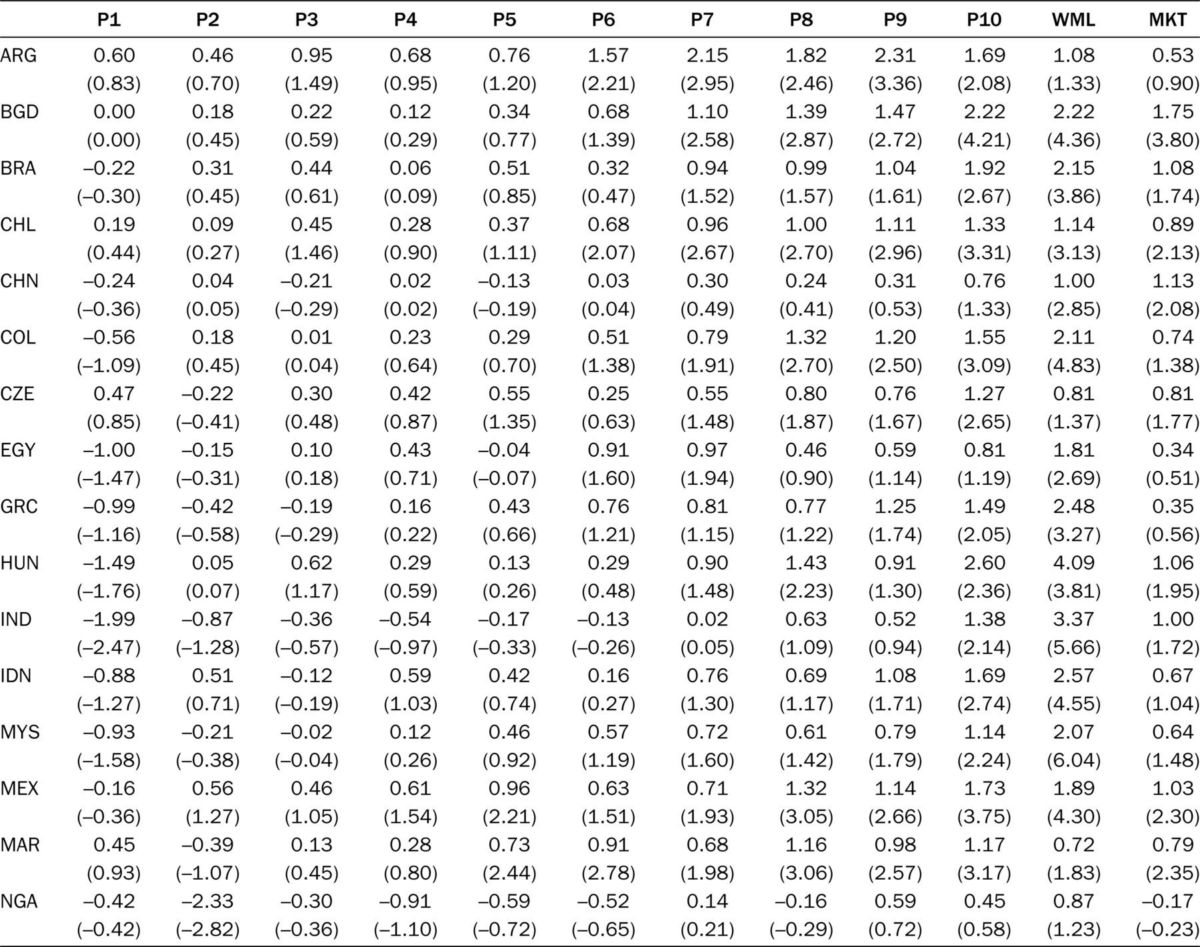
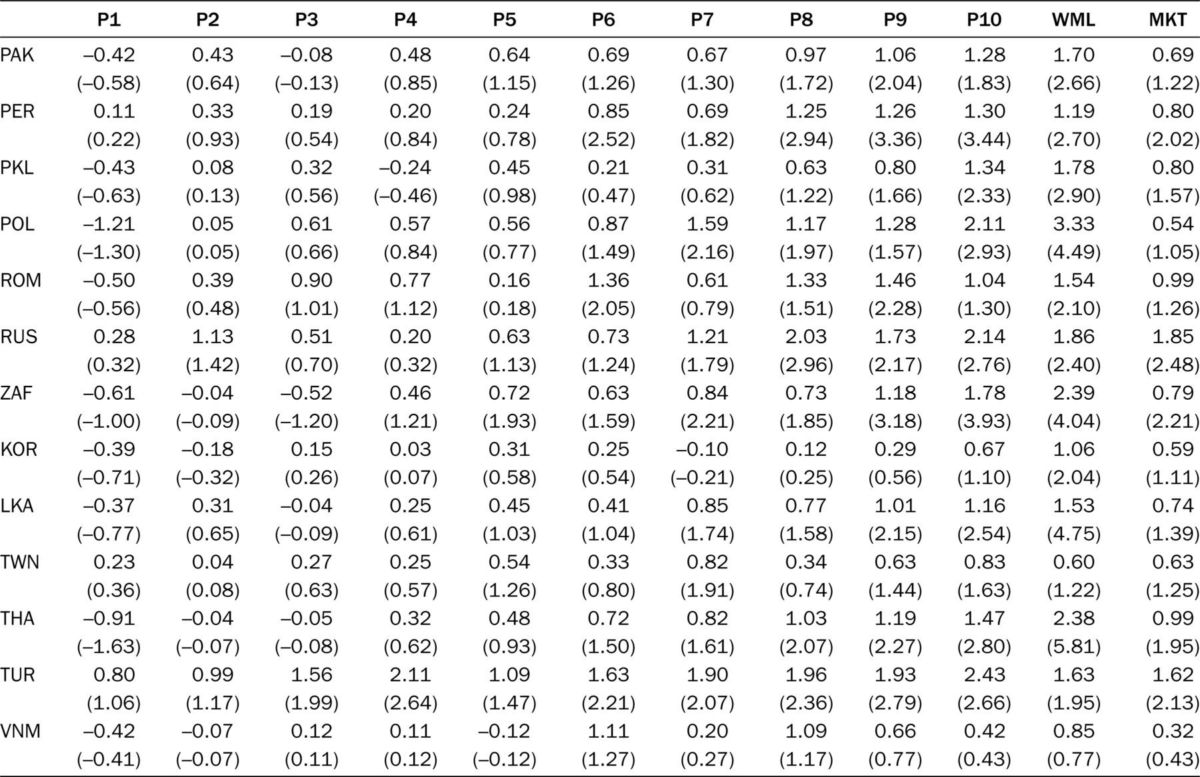
The results are hypothetical results and are NOT an indicator of future results and do NOT represent returns that any investor actually attained. Indexes are unmanaged, do not reflect management or trading fees, and one cannot invest directly in an index.
Atilgan, Demirtas, Gunaydin, and Kirli also examined other characteristics of the WML portfolio and found:
- In more than half of the countries, higher momentum returns were associated with higher volatilities.
- Volatility tended to show a u-shaped pattern, showing their maximum values in loser portfolios, decreasing and having their minimum values in Deciles 5 to 7, and then increasing approaching winner portfolios.
- Sharpe ratios of WML portfolios were at least as high as those of market portfolios in all emerging markets—higher mean returns associated with WML portfolios were large enough to offset their additional volatilities.
- Sharpe ratios generally increased across momentum deciles, while the loser portfolio had a negative Sharpe ratio in 18 emerging markets.
- WML returns were negatively skewed in 19 emerging markets, and they were more negatively or less positively skewed than aggregate returns in 20 emerging markets. However, the skewness statistic for the winner portfolio was lower than that of the loser portfolio in all but three emerging markets (long-only portfolios reduce the risk of momentum crashes).
- WML portfolios were negatively exposed to the market, creating crash risk.
- The abnormal return of the WML portfolio tended to be driven by both the overperformance of the long leg and the underperformance of the short leg with respect to the market model.
- Benchmarking against an emerging five-factor model showed that the positive returns to the WML portfolio could not be explained by common factors.
- Considering downside risk, the average reward-to-volatility ratio of the momentum strategy was higher than that of the aggregate market portfolio in all emerging markets except Bangladesh for the 36-month window and in all emerging markets for the 60-month window. In addition, the Sortino ratio was higher for the WML portfolio than for the market portfolio in all but two emerging markets.
Their findings led Atilgan, Demirtas, Gunaydin, and Kirli to conclude:
“Even after adjusting for downside risk, momentum strategy outperforms a passive investment strategy in the market portfolio in a vast majority of emerging markets.”
Investor Takeaways
There is strong empirical evidence demonstrating that momentum (both cross-sectional and time-series) provides information on the cross-section of returns and has generated alpha relative to existing asset pricing models. Atilgan, Demirtas, Gunaydin, and Kirli’s study adds to that body of research by providing another test of pervasiveness. For investors considering adding exposure to momentum the evidence demonstrates that because momentum has negative exposure to market beta, it is subject to crash risk during market reversals (such as occurred in March 2009). The good news is that long-only momentum strategies are not subject to that crash risk, and researchers have uncovered strategies that have reduced crash risk—crashes are at least partly forecastable, tending to occur in “panic” states following market declines and when market volatility is high, and are contemporaneous with market rebounds. For example, Pedro Barroso and Pedro Santa-Clara, authors of the 2015 study “Momentum has its Moments,” found that the risk of momentum is highly variable over time, is predictable by its own realized variance, and that there is a negative relationship of momentum volatility and subsequent returns—momentum volatility increases in times of momentum crashes. The management of that risk virtually eliminated crashes and nearly doubled the Sharpe ratio of the momentum strategy. Other studies, including the 2016 study “Momentum Crashes,” the 2017 study “A Century of Evidence on Trend-Following Investing,” the 2018 study “The Impact of Volatility Targeting” and the 2019 study “Portfolio Management of Commodity Trading Advisors With Volatility Targeting,” have also found that momentum strategies have benefited from scaling volatility.
Further research, including the 2020 studies “Conditional Volatility Targeting” and “Understanding Volatility-Managed Portfolios,” have found that scaling strategies could be improved on by making them conditional on volatility states, reducing risk exposures during high volatility states, increasing risk exposures during low volatility states, and maintaining an unscaled exposure otherwise.
Disclaimers
For informational and educational purposes only and should not be construed as specific investment, accounting, legal, or tax advice. Certain information is based upon third party data and may become outdated or otherwise superseded without notice. Third party information is deemed to be reliable, but its accuracy and completeness cannot be guaranteed. By clicking on any of the links above, you acknowledge that they are solely for your convenience, and do not necessarily imply any affiliations, sponsorships, endorsements or representations whatsoever by us regarding third-party websites. We are not responsible for the content, availability or privacy policies of these sites, and shall not be responsible or liable for any information, opinions, advice, products or services available on or through them. The opinions expressed by featured authors are their own and may not accurately reflect those of Buckingham Strategic Wealth® or Buckingham Strategic Partners®, collectively known as Buckingham Wealth Partners. Neither the Securities and Exchange Commission (SEC) nor any other federal or state agency have approved, determined, or confirmed the adequacy of this article. LSR-22-374
About the Author: Larry Swedroe
—
Important Disclosures
For informational and educational purposes only and should not be construed as specific investment, accounting, legal, or tax advice. Certain information is deemed to be reliable, but its accuracy and completeness cannot be guaranteed. Third party information may become outdated or otherwise superseded without notice. Neither the Securities and Exchange Commission (SEC) nor any other federal or state agency has approved, determined the accuracy, or confirmed the adequacy of this article.
The views and opinions expressed herein are those of the author and do not necessarily reflect the views of Alpha Architect, its affiliates or its employees. Our full disclosures are available here. Definitions of common statistics used in our analysis are available here (towards the bottom).
Join thousands of other readers and subscribe to our blog.