This post focuses on the costs and benefits of including generic broad-based emerging market exposures in one’s portfolio (Note, we do not discuss factors/freedom/etc.). The analysis of emerging markets investing is not meant to be exhaustive and/or highly complex. Nor is it meant to sway the reader in one direction or the other.
Like all things in life, there are costs/benefits to everything and everyone needs to identify a solution that suits their specific needs. Contact us if you’d like to wargame how emerging market exposure plays out in your model portfolios.
Emerging markets investing and factors methodologies
Side note: we are often asked why we don’t deploy our factor methodologies in emerging markets, but instead, we focus exclusively on the US and Developed markets. This particular discussion is long and would probably require its own blog post, so we will sidestep it for now.(1)
Domestic, Developed, and Emerging Performance Comparison
Our first objective is to establish the baseline facts regarding US stock market investing, Developed market stock investing, and Emerging market stock investing.
We splice long-term datasets across Global Financial Data, Standard and Poors, and MSCI to create long history monthly total return series for US/Dev/EM stock markets.(2) Inquiring minds might ask, “How reliable is the data on the US, Developed, and Emerging markets investing prior to 1990?” Well, that is a good question, but unless someone has a better solution, this is the best data we can muster!
We also assume a generic transaction cost schedule from a US-centric investor’s perspective. Identifying the exact mix of commissions, impact costs, and tax costs is extremely difficult (obviously costs were much higher earlier in the period and lower later in the sample). And while it is hard to say if the fee estimates are correct, we do believe that their rank order is roughly correct — US is cheaper than Developed, and Developed is cheaper than Emerging.
- US Stocks = US broad stock market net of 50bps in transaction costs.
- Developed Stocks = Developed broad stock market net of 75bps in transaction costs.
- Emerging Stocks = Emerging broad stock market net of 150bps in transaction costs.(3)
Next, we look at the overall performance profile of these stock markets over a long period (1/1/1927 to 5/31/2022) (almost 100 years!).
Here is a chart that compares common statistics related to performance:(4)
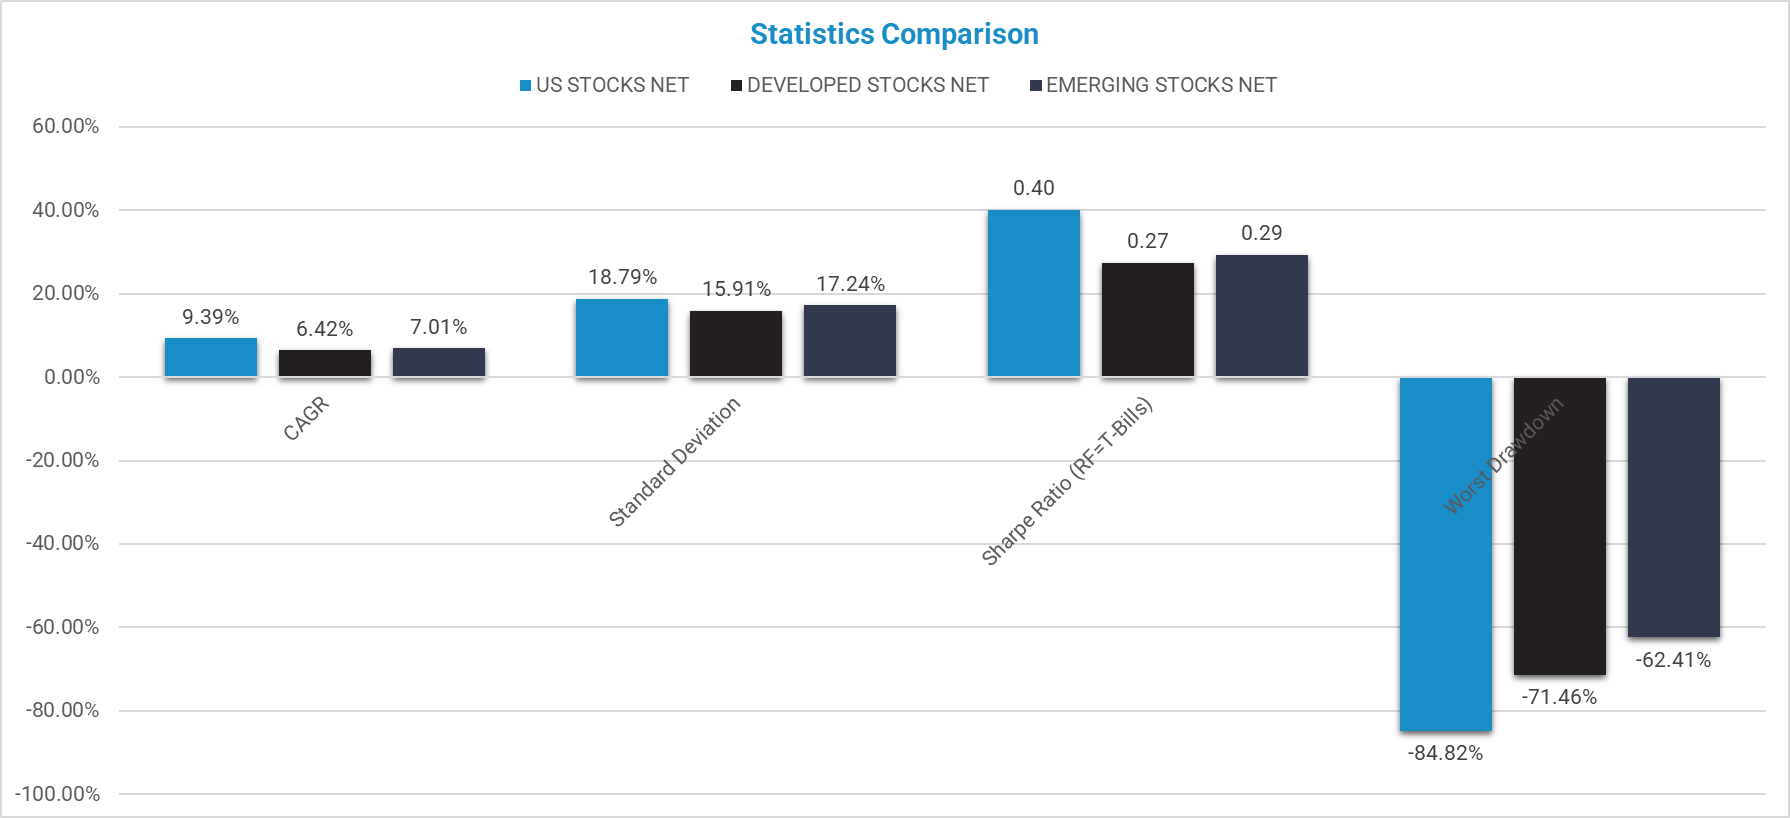
Key points:
- The US market has the best overall absolute and risk-adjusted-performance over this sample period (also the highest drawdown!). Disclaimer: perhaps the US stock market is an anomaly?
- There is roughly a “tie” across developed and emerging stocks over the sample period (at least on a risk-adjusted basis).
Let’s dig a bit more into the drawdown profiles
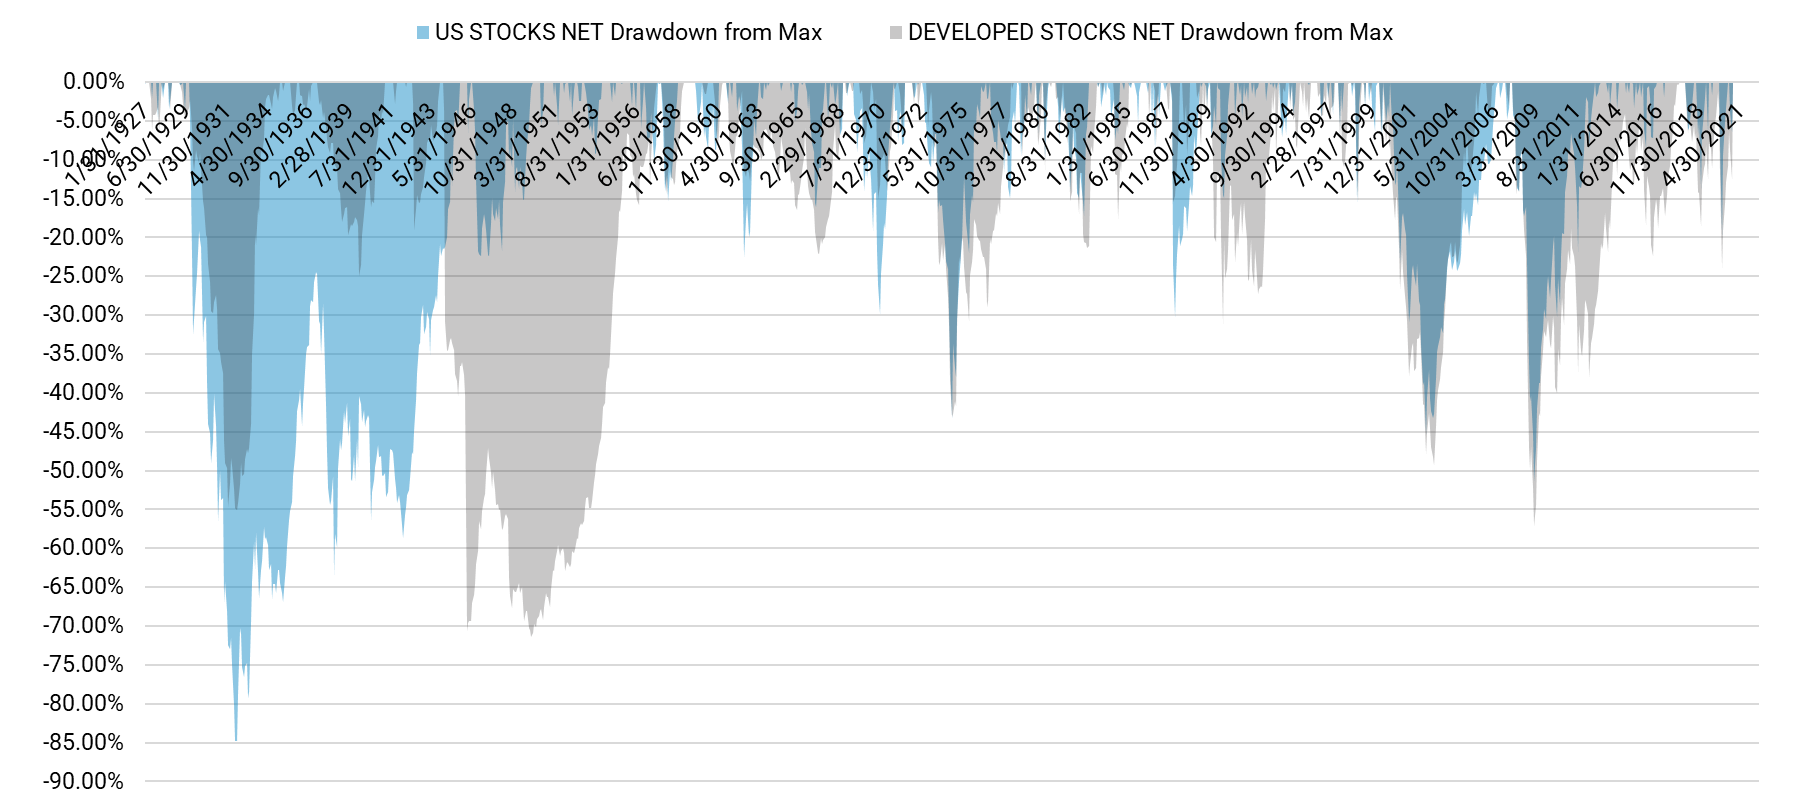
Here are the drawdown profile of the US and Developed stocks:
Here is the drawdown profile of US stocks against Emerging stocks:
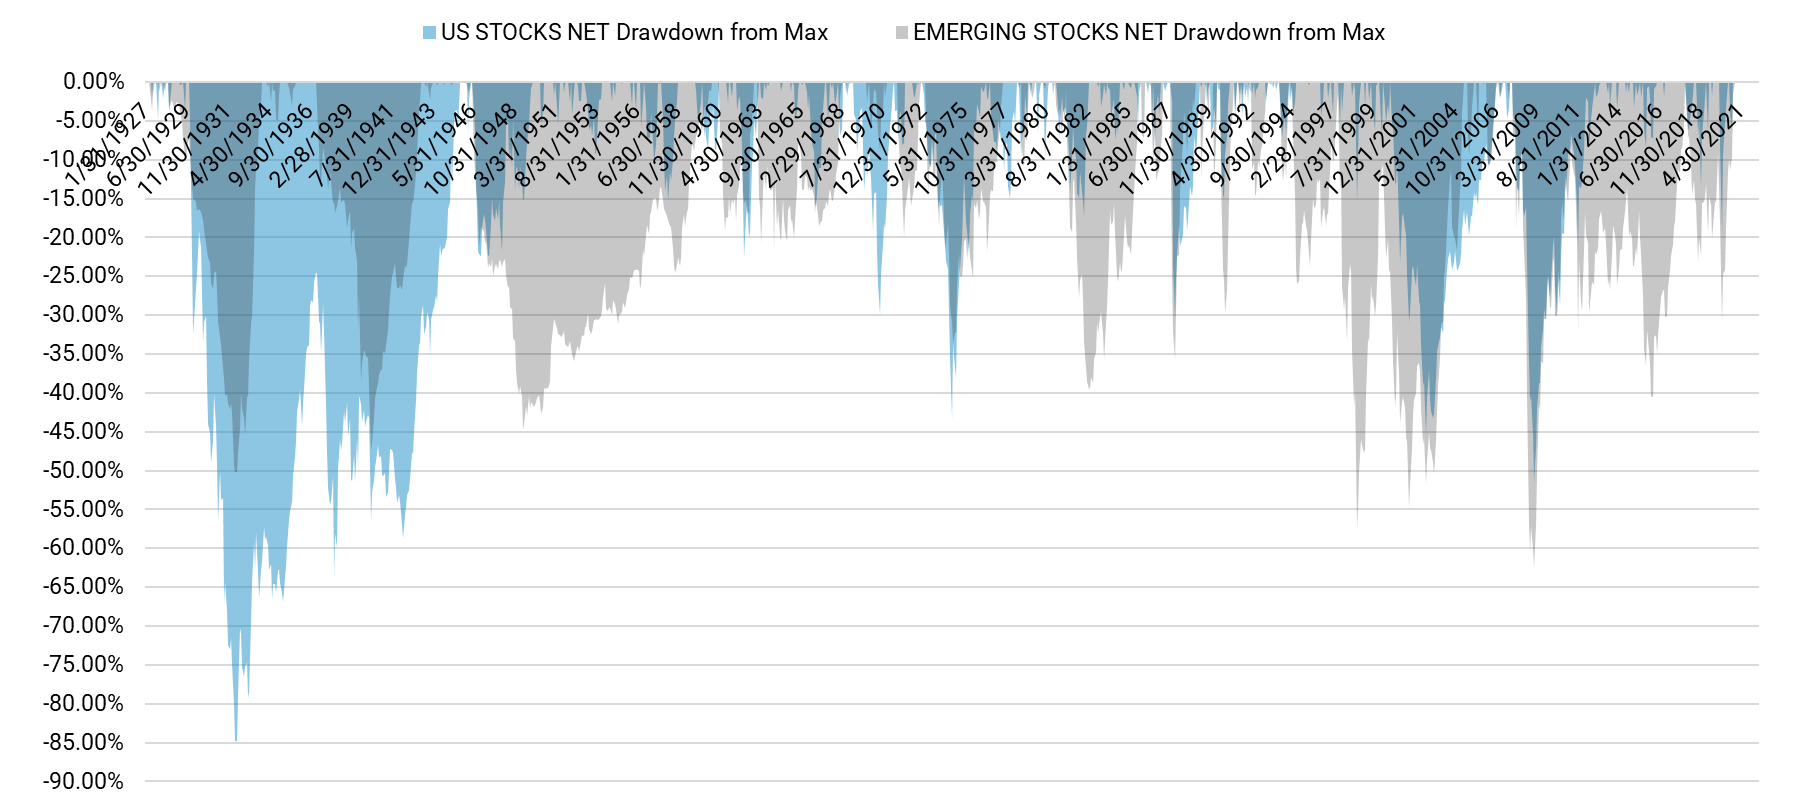
Key points from the drawdown charts:
- Equity stock markets drawdown at roughly the same time.
- Emerging markets tend to have more frequent drawdowns.
How Does Emerging Markets Play out in a Portfolio Context?
The good news for investors is that we don’t necessarily need to go all-in on a single geography. We could own different things and hope that the structural difference in the underlying bets helped smooth the investment path, over the long haul.
Below is the first look at this concept, where we examine the following portfolios:
- US 50% DEV 50% = US stocks 50% and Developed stocks 50%
- US 40% DEV 40% EM 20% = US stocks 40% and Developed stocks 40% and Emerging stocks 20%
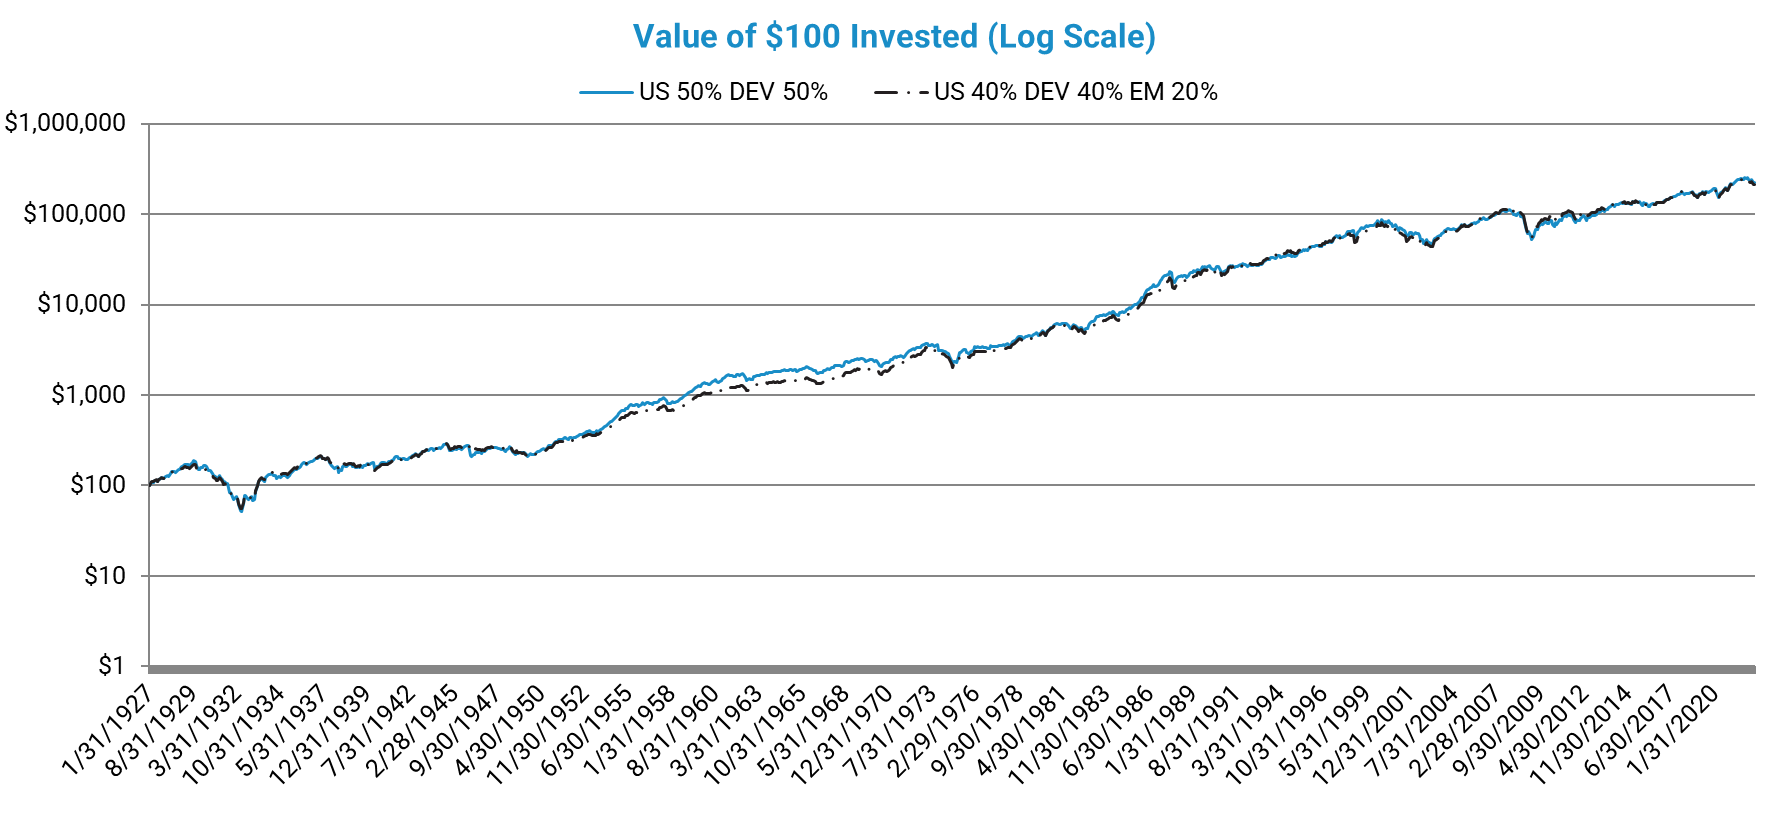
One really has to squint to see any material difference in outcome over the long haul. Here are the underlying statistics.
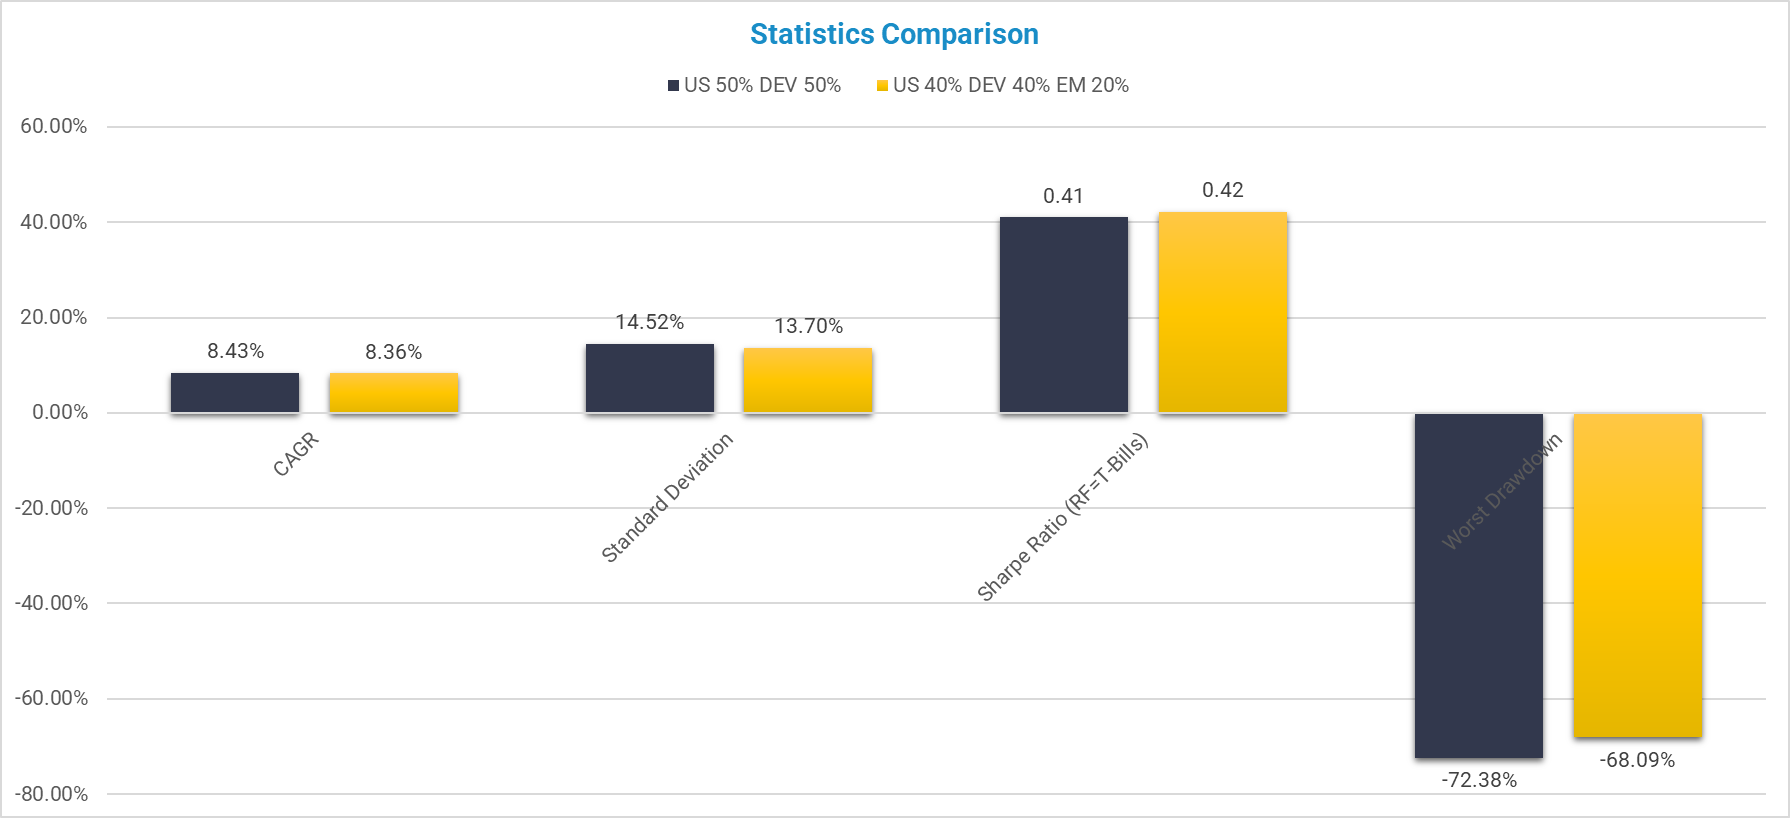
At first glance, adding Emerging stocks to a portfolio doesn’t really seem to affect one’s outcomes. But maybe there are differences in the drawdown profile that can’t be captured by the generic statistics. Here we look at the drawdowns on the portfolios above:
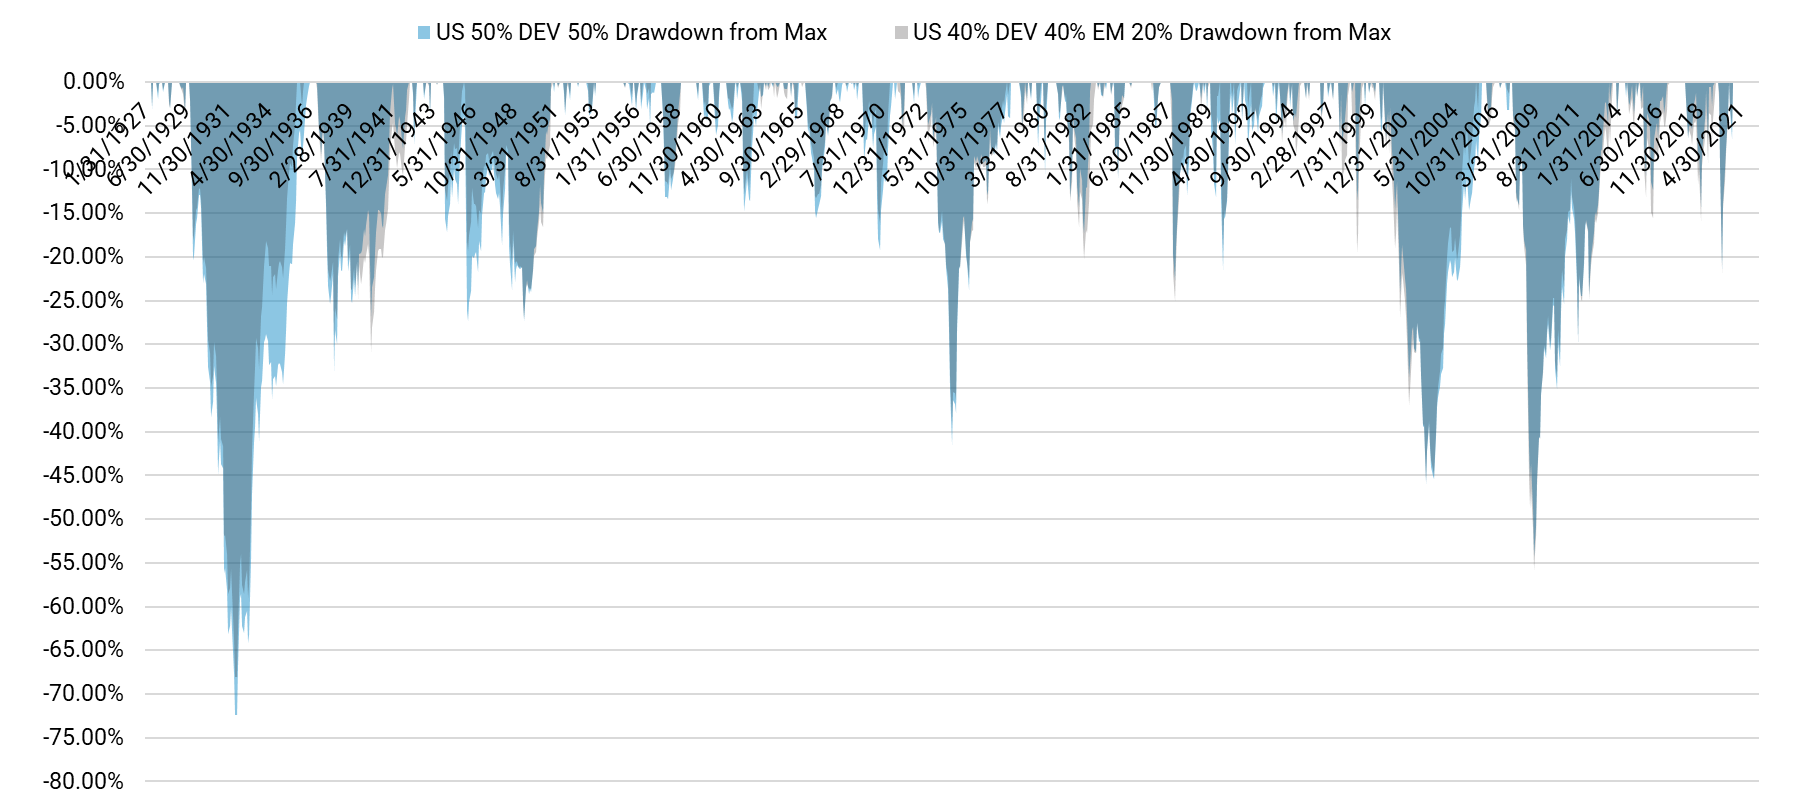
The portfolios essentially look the same. So arguing whether an EM allocation does or does not make sense really boils down to a philosophical debate, because empirically, the w/EM and w/o EM strategies look similar.
What if we throw bonds into the mix?
The analysis above looks at equity-only portfolios, but perhaps there are other diversification benefits tied to different equity approaches in a broader portfolio mix. Below we create 60/40 portfolios that include intermediate-term treasury bonds in the portfolio.
- Global EQ (No EM) / 40% Bonds = 60% in (US 50% DEV 50%), 40% in Intermediate-Term US Treasury
- Global EQ / 40% Bonds = 60% in (US 40% DEV 40% EM 20%), 40% in Intermediate-Term US Treasury
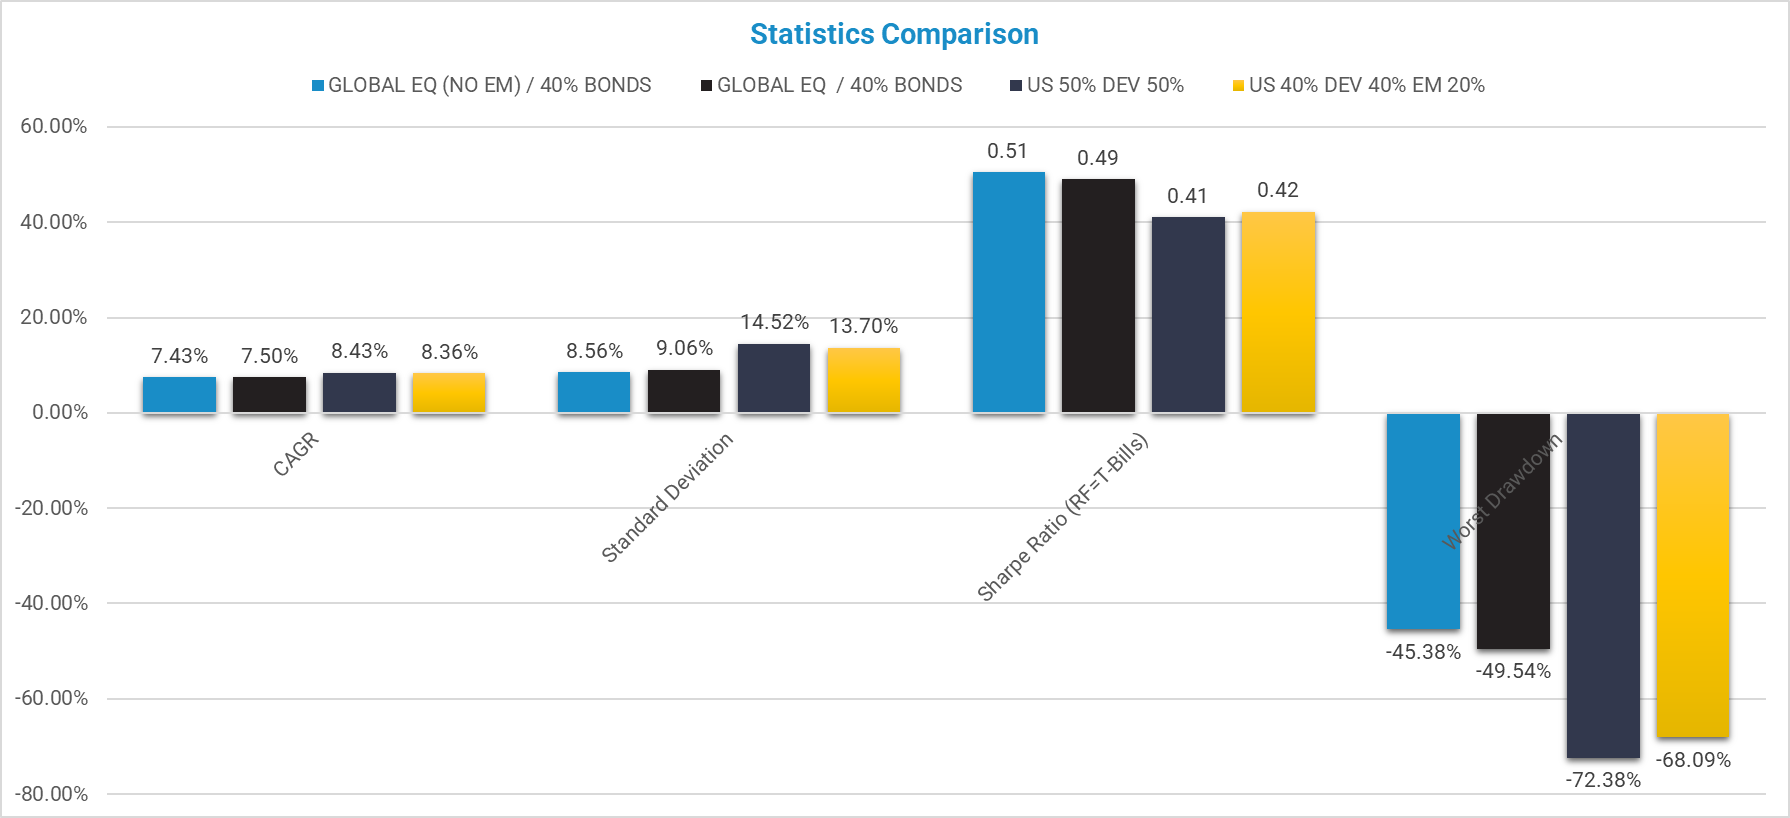
Adding Emerging to the mix increases the volatility and drawdowns a bit, but we’d call it effectively a “tie.”
To Add or Not to Add Emerging Stocks: That is the Question
The analysis above suggests that portfolios that include or exclude emerging allocations are roughly the same. For some readers, this may be a surprise, but for many readers, this may not be “news.” That said, even if the data don’t strictly justify an Emerging allocation, the first principle of “stay diversified” might be enough to make an allocation.
Of course, the assumptions always matter.
The biggest driver of investment results typically boils down to a boring discussion of the simple math:
net returns = gross returns
– costs (taxes + transaction costs + management fees + liquidity + brain damage)
We assumed a differential in costs across the US, DEV, and EM that may or may not be reasonable. For example, if we assume that the net costs of EM are even higher, the case for EM weakens; on the flipside, if we think accessing EM is less costly than estimated, the net benefits of an EM allocation may be more compelling.
In the end, investing (and especially emerging markets investing) is simple, but not easy. We are always here to help you think through your investment model situation. Feel free to hit our dream team of Jack, Ryan, and Jess if you’d like to discuss emerging markets in your portfolio.
References[+]
| ↑1 | Through a 3rd party arrangement we do offer our systems on the Canadian markets as well. Also, we are not 100% against EM factor concepts and the evidence that factors work in emerging markets is solid.
The core reason we don’t build factor-based emerging market exposures are as follows: 1) taxes and frictional costs are harder to manage, 2) the marginal value of EM allocation in an already well-diversified portfolio is controversial, 3) the business case is challenging (high costs and a small market), and 4) we love Freedom :-) |
|---|---|
| ↑2 | details available upon request |
| ↑3 | All portfolios are value-weighted and USD-based. That means market-cap-weighted for you non-geeks. All portfolios are indexes. The results are hypothetical results and are NOT an indicator of future results and do NOT represent returns that any investor actually attained. Indexes are unmanaged and do not reflect management or trading fees, and one cannot invest directly in an index. Results are gross of management fees and transaction costs, unless otherwise noted. All returns are total returns and include the reinvestment of distributions (e.g., dividends). The time period analyzed is from 1/1/1927 to 5/31/2022. |
| ↑4 |
The definitions of each statistic are outlined below:
|
About the Author: Wesley Gray, PhD
—
Important Disclosures
For informational and educational purposes only and should not be construed as specific investment, accounting, legal, or tax advice. Certain information is deemed to be reliable, but its accuracy and completeness cannot be guaranteed. Third party information may become outdated or otherwise superseded without notice. Neither the Securities and Exchange Commission (SEC) nor any other federal or state agency has approved, determined the accuracy, or confirmed the adequacy of this article.
The views and opinions expressed herein are those of the author and do not necessarily reflect the views of Alpha Architect, its affiliates or its employees. Our full disclosures are available here. Definitions of common statistics used in our analysis are available here (towards the bottom).
Join thousands of other readers and subscribe to our blog.