There are basically two types of investors, those that are risk averse and, thus, both demand risk premiums for taking risk and diversify their holdings, and those who are risk seekers who have a preference for positively skewed (lottery-like) returns which leads them to speculate and concentrate risks. The psychological preferences of risk seekers drives up the valuations of the lottery-like stocks, leading to their underperformance—stocks with high CAPM betas and high daily MAX returns have earned below market returns despite their greater risk.
Motivated by research that has demonstrated that the aggregate stock market has co-movement related to speculative demand driven by optimistic noise trader sentiment and that periods of high market speculation can obscure the unconditional risk-return tradeoff for the aggregate market, Soroush Ghazi and Mark Schneider authors of the August 2022 study “Market Risk and Speculation Factors” decomposed the excess market return (the equity risk premium) into speculative (in the simple sense that it is negative, reflecting a premium investors pay to hold assets that are more subject to speculative demand) and non-speculative, or risk (in the simple sense that it is positive, a necessary characteristic for a factor to reflect compensation for risk) components. Their measure of the speculative return was mainly based on the research from two studies:
- Mispricing Factors by Robert Stambaugh and Yu Yuan who split anomalies into two clusters. The first represented quantities that management can affect directly, an MGMT factor: net stock issues, composite equity issues, accruals, net operating assets, asset growth, and investment to assets. The second cluster is related to performance, a PERF factor, that included: distress, O-score, momentum, gross profitability, and return on assets.
- Short- and Long-Horizon Behavioral Factors by Kent Daniel, David Hirshleifer, and Lin Sun who split anomalies (mispricings) into a financing factor (FIN), a composite of the one-year net-share-issuance and five-year composite-share-issuance— their long-horizon factor—and post-earnings announcement drift (PEAD)—the short-horizon factor.
Their measures of market sentiment was based on Malcolm Baker and Jeffrey Wurgler’s study “Investor Sentiment and the Cross-Section of Stock Returns” and Dashan Huang, Fuwei Jiang, Jun Tu, and Guofu Zhou’s study “Investor Sentiment Aligned: A Powerful Predictor of Stock Returns.” (discussed here on the blog).
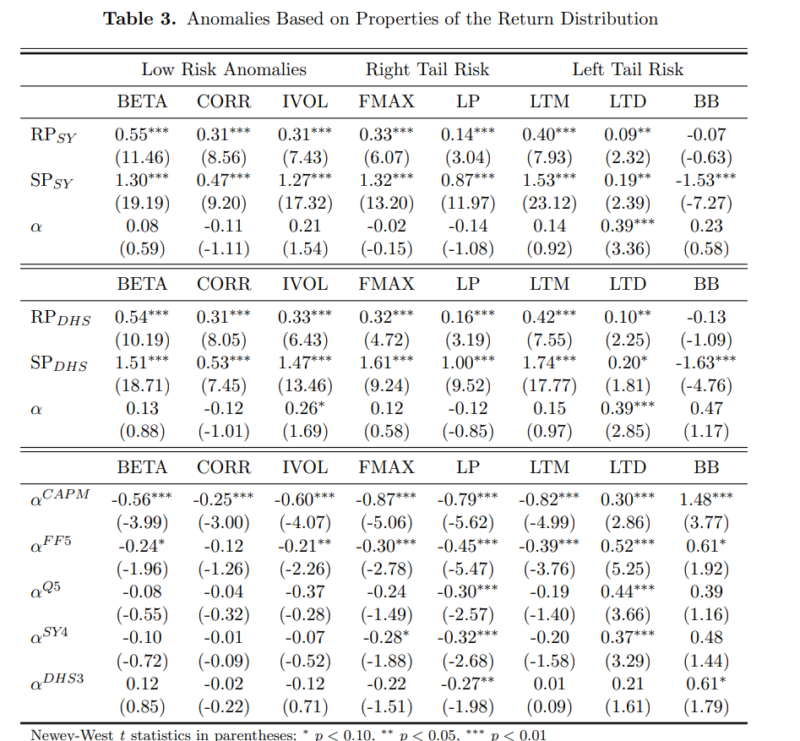
Ghazi and Schneider considered three groups of anomalies: (i) anomalies based on risk characteristics (statistical properties of the return distribution); (ii) the standard risk factors in the Fama and French six-factor model (beta, size, value, momentum, profitability and investment); (iii) the 11 anomalies based on firm characteristics from Stambaugh and Yuan. They considered eight anomalies that pertain to statistical properties of the return distribution: three low risk anomalies (the betting-against-beta factor, the betting-against-correlation factor, and the idiosyncratic volatility factor); two right-tail risk anomaly portfolios (the lottery demand factor and the lottery preference factor); and three left-tail risk anomaly portfolios (the decile portfolio long [short] stocks with high [low] lower tail dependence with the market return, the decile portfolio long (short) stocks with high (low) exposure to the risk-neutral probability of a future bear market state, and the left-tail momentum factor that is long (short) stocks with high (low) value-at-risk. Their data sample covered the period 1963-2016.
Following is a summary of their findings:
- The speculative return was negative and predicted by market sentiment (which has been found to be negatively correlated with returns) while the risk return was positive and was not predicted by sentiment. The unconditional market risk premium was roughly 1.2 percent per month, while the unconditional market speculation premium was nearly -0.7 percent per month.
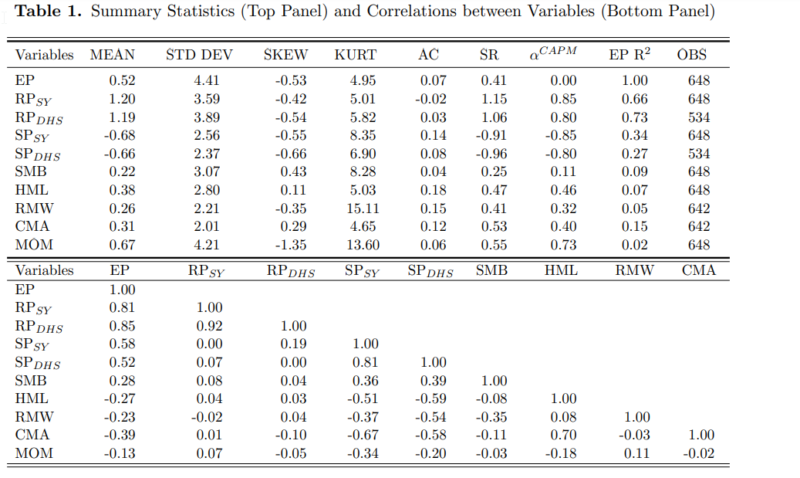
- The speculation component explained about one-third of the variation in the excess market return with the risk component explaining about two-thirds.
- Controlling for both market risk and market speculation renders abnormal returns from a broad set of 25 CAPM anomalies to be mostly insignificant—the number of significant alphas fell to just two, and none of the 11 Stambaugh and Yuan anomalies showed significant alphas after controlling for market risk and market speculation.
- High beta stocks load positively on the risk premium, indicating that high beta stocks earned a higher risk premium than low-beta stocks due to their higher systematic risk. However, the high beta portfolio also loaded positively on the speculative premium (which is negative), indicating that high beta stocks are also more subject to speculative demand than low beta stocks. The same result was found for other low risk anomalies such as betting against correlation and idiosyncratic volatility (IVOL).
- Similar to the findings for the beta, correlation, and IVOL anomalies, lottery-like stocks load positively and significantly on the risk premium factor (RP), earning a positive risk premium, but load positively and significantly on the speculative premium (SP) factor, earning a negative speculation premium. Their considerably larger SP betas compared to their RP betas contributed to their low average returns.
- While the Fama-French factors of size, value, profitability, and investment co-moved significantly with the market factor, virtually none of the co-movement could be attributed to the market risk component, which had correlations close to zero with those factors. Instead, the correlations of these factors with the market speculation component increased considerably beyond the correlations of these factors with the overall market factor—the co-movement of the Fama-French factors with the market factor reflected co-movement with market speculation rather than co-movement with the risk component of the market factor.
- Market risk and speculation factors price the Fama-French value (HML), profitability (RMW), and investment (CMA) factors and the momentum factor, though not the size factor (SMB).
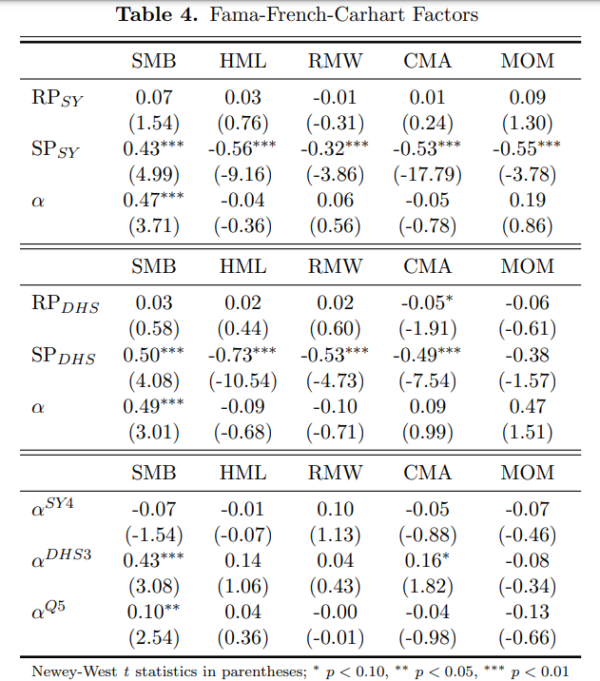
- Providing support for the long-standing intuition that value stocks have greater risk, whereas growth stocks are more subject to speculation, value stocks had greater exposure to market risk while growth stocks had greater exposure to the speculative factor.
- The lottery preference (LP) factor is priced by the market risk and speculation factors.
- Firms with higher distress risk (the short legs of the distress and 0-score anomalies) had both greater risk and were more subject to speculation. The net result was after accounting for their exposures to the risk and speculative factors, there no longer was any statistically significant alpha.
Investor Takeaways
Identifying whether returns reflect compensation for risk or mispricing is a classical problem in finance dating to the early days of the efficient market hypothesis. The research we reviewed demonstrates that proposed pairs of mispricing factors help to explain co-movement in the cross-section of returns that is related to mispricing. Ghazi and Schneider showed that positive risk-return tradeoffs and negative mispricing-return relations co-exist, providing unifying insights from traditional and behavioral finance and a more complete explanation of many anomalies. They also showed that the risk component is not related to market sentiment (investor behavior). And perhaps most importantly, they showed that stocks that are viewed as riskier (such as stocks with high CAPM betas, high idiosyncratic volatility, high left-tail risk, or high distress risk) do load positively and significantly on the risk component even after controlling for mispricing—riskier stocks earn higher average returns from their exposure to the non-speculative component of the market return, though not higher enough to overcome the negative premium from the speculative factor. That finding explains many of the prominent anomalies in the literature.
Disclosures
For informational and educational purposes only and should not be construed as specific investment, accounting, legal, or tax advice. Certain information is based upon third party data and may become outdated or otherwise superseded without notice. Third party information is deemed to be reliable, but its accuracy and completeness cannot be guaranteed. By clicking on any of the links above, you acknowledge that they are solely for your convenience, and do not necessarily imply any affiliations, sponsorships, endorsements or representations whatsoever by us regarding third-party websites. We are not responsible for the content, availability or privacy policies of these sites, and shall not be responsible or liable for any information, opinions, advice, products or services available on or through them. The opinions expressed by featured authors are their own and may not accurately reflect those of Buckingham Strategic Wealth® or Buckingham Strategic Partners®, collectively known as Buckingham Wealth Partners. Neither the Securities and Exchange Commission (SEC) nor any other federal or state agency have approved, determined, or confirmed the adequacy of this article. LSR-22-366
About the Author: Larry Swedroe
—
Important Disclosures
For informational and educational purposes only and should not be construed as specific investment, accounting, legal, or tax advice. Certain information is deemed to be reliable, but its accuracy and completeness cannot be guaranteed. Third party information may become outdated or otherwise superseded without notice. Neither the Securities and Exchange Commission (SEC) nor any other federal or state agency has approved, determined the accuracy, or confirmed the adequacy of this article.
The views and opinions expressed herein are those of the author and do not necessarily reflect the views of Alpha Architect, its affiliates or its employees. Our full disclosures are available here. Definitions of common statistics used in our analysis are available here (towards the bottom).
Join thousands of other readers and subscribe to our blog.