Two of the more interesting puzzles in finance are related to volatility—stocks with greater idiosyncratic volatility (IVOL) have produced lower returns and stocks with high uncertainty about risk, as measured by the volatility of expected volatility (vol-of-vol), underperform stocks with low uncertainty. These are anomalies because greater risk should be compensated with higher expected returns. We’ll examine the literature on these two anomalies.(1)
Idiosyncratic Volatility
Robert Stambaugh, Jianfeng Yu and Yu Yuan, authors of the study “Arbitrage Asymmetry and the Idiosyncratic Volatility Puzzle,” which appeared in the October 2015 issue of The Journal of Finance, provide an explanation, and the evidence, for why the idiosyncratic volatility anomaly persists post publication.
They begin with the hypothesis that idiosyncratic volatility (IVOL) represents risk that deters arbitrage activity, which reduces mispricing. The authors then combine this concept with what they term “arbitrage asymmetry”—the greater ability and/or willingness of investors to take a long position as opposed to a short position when they perceive mispricing. This asymmetry occurs because there are greater risks and costs involved in shorting, including the potential for unlimited losses.
In addition to the greater risks and costs of shorting, for stocks with a low level of institutional ownership, there may not be enough shares available to borrow in order to sell short. Because institutions are the main lenders of securities, when institutional ownership is low, the supply of stocks to loan tends to be sparse and short selling tends to be more expensive. Furthermore, the charters of many institutions prevent, or severely limit, shorting. And finally, there is the risk that adverse moves can force capital-constrained investors to reduce their short positions before realizing profits that would ultimately result from corrections of mispricing. Importantly, when IVOL is higher, substantial adverse price moves are more likely. The authors write: “Combining the effects of arbitrage risk and arbitrage asymmetry implies the observed negative relation between IVOL and expected return.”
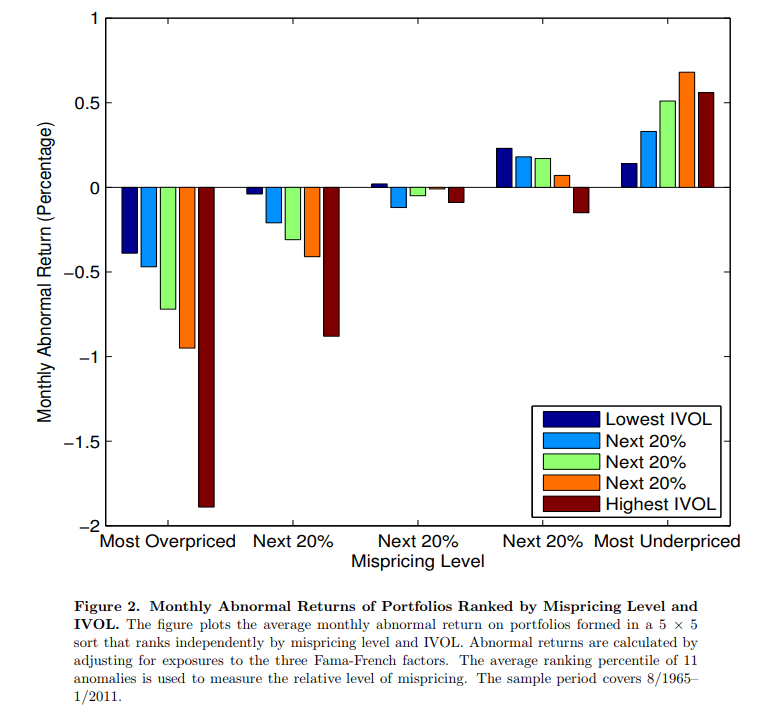
To see the effect of limits to arbitrage and arbitrage asymmetry, Stambaugh, Yu and Yuan note that stocks with greater IVOL, and thus greater arbitrage risk, should be more susceptible to mispricing that isn’t eliminated by arbitrageurs. Among overpriced stocks, the IVOL effect in expected return should therefore be negative. Stocks with the highest IVOL should be the most overpriced. However, with arbitrage asymmetry, the reverse isn’t true, as the greater willingness to buy (versus short) allows arbitrageurs to eliminate more underpricing than overpricing.
The authors explain: “The differences in the degree of underpricing associated with different levels of IVOL should be smaller than the IVOL-related differences in overpricing. That is, the negative IVOL effect among overpriced stocks should be stronger than a positive IVOL effect among underpriced stocks. When aggregating across all stocks, the negative IVOL effect should therefore dominate and create the observed IVOL puzzle.”
Testing the Hypothesis
To test their hypothesis, Stambaugh, Yu and Yuan constructed a proxy for mispricing—a composite measure averaging each stock’s rankings associated with 11 return anomalies (net stock issuance, equity issuers, accruals, net operating assets, asset growth, investment-to-assets, distress, O-score, momentum, gross profitability, and return on assets) that are violations of the Fama-French three-factor (market beta, size and value) model. They found:
- After assigning stocks each month to deciles based on their measure, the following month’s spread in benchmark-adjusted returns between the two extreme deciles averaged 1.5 percent over their sample period (August 1965 through January 2011) and was highly statistically significant.
- The IVOL effect is significantly negative (positive) among the most overpriced (underpriced) stocks and the negative effect among the overpriced stocks is significantly stronger—3.7 times the magnitude of the corresponding positive difference among the most underpriced stocks.
- The vast majority of the differences in returns were explained by the short side (the most overpriced stocks).
- IVOL increased monotonically moving across deciles from the most underpriced to the most overpriced.
- The negative IVOL effect among overpriced stocks is stronger for stocks which are less easily shorted (as proxied by stocks with low institutional ownership).
- While the IVOL effect was strongest among overpriced small stocks—consistent with small stocks being more difficult/expensive to short than large stocks—the effect holds for large stocks as well, though it’s no longer statistically significant at conventional levels.
- The negative IVOL effect among overpriced stocks is significantly stronger following months when investor sentiment is high, and the positive IVOL effect among underpriced stocks is significantly stronger following months when investor sentiment is low.
Summarizing, the study from Stambaugh, Yu and Yuan not only helps us understand the role that idiosyncratic volatility plays in explaining returns, but it also helps us understand why the anomaly persists.
We turn now to the second volatility puzzle.
Stocks with High Risk Uncertainty Underperform
Guido Baltussen, Sjoerd van Bekkum, and Bart van der Grient contribute to literature on volatility puzzles with their study “Unknown Unknowns: Uncertainty About Risk and Stock Returns” published in the August 2018 issue of the Journal of Financial and Quantitative Analysis. The authors measured uncertainty about risk by the volatility of expected volatility (vol-of-vol) in options prices. Their database was U.S.-listed individual options on stocks trading on the New York Stock Exchange (NYSE), American Stock Exchange (AMEX), and National Association of Securities Dealers Automated Quotation (NASDAQ) (all of which are American) over the period from 1996 through 2014. The following is a summary of their findings:
- Stocks with higher vol-of-vol earn significantly lower future returns than otherwise similar stocks.
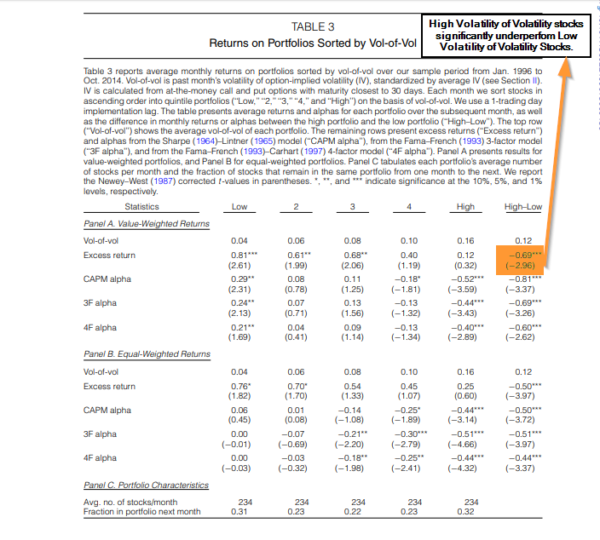
- Stocks in the highest vol-of-vol quintile underperform stocks in the lowest vol-of-vol quintile by 0.69 percent (0.50 percent) on a value-weighted (equal-weighted) basis in the month following portfolio formation.
- The negative vol-of-vol effect is not explained by loadings on the market, the Fama–French (1993) size and book-to-market factors, or the Carhart (1997) momentum factor, with a 4-factor alpha of −0.60 percent (−0.44 percent) a month for the high-minus-low value-weighted (equal-weighted) vol-of-vol portfolio.
- The data holds for larger and more liquid stocks, which is not the case for most anomalies.
- The vol-of-vol effect persists after controlling for short-sale constraints.
- The vol-of-vol effect is distinct from more than 20 previously documented return drivers, is robust to a variety of vol-of-vol definitions, persists up to 24 months after portfolio formation, and holds up out-of-sample (Europe).
- The vol-of-vol effect remains economically and statistically significant after controlling for stock-level variation in implied volatility.
- The negative vol-of-vol effect is present in more than 60 percent of the months, and negative returns tend to be larger (in absolute terms) than positive returns for most years throughout the sample period.
Baltussen, Bekkum, and van der Grient offer the following possible explanations for the anomaly. First, the negative effect of uncertainty about risk on future stock returns is due to investors having a “structural preference for uncertainty about risk.” This is related to the “lottery effect”. Another explanation is the following:
…if investors’ uncertainty about risk preferences or expectations are sufficiently dispersed and uncertainty about risk sufficiently large, investors with relatively high uncertainty aversion and/or pessimistic uncertainty expectations may cease participating in a stock. Therefore, the uncertain assets are held, and priced, only by investors with a sufficiently optimistic view on (or low aversion against) uncertainty, and therefore require low uncertainty premiums.
They cited papers that provide evidence supporting this hypothesis. Supporting the limited participation hypothesis is that they found that stocks with higher levels of uncertainty about risk are also associated with lower future trading activity.
Baltussen, Bekkum, and van der Grient also found that in the lowest short-sales constraint quintile the vol-of-vol effect is smallest in magnitude and statistically indistinguishable from 0. These results suggest that the vol-of-vol effect is more pronounced among stocks held less by institutional investors, which are therefore more difficult to short (the limits to arbitrage hypothesis).
Also of interest is that the vol-of-vol anomaly is related to the low beta (volatility) anomaly as high vol-of-vol stocks have higher market betas. And they also have higher idiosyncratic volatility. In addition, they exhibit both positive skewness and excess kurtosis. Thus, they are related to the lottery effect anomaly found in IPOs, penny stocks, stocks in bankruptcy and small growth stocks with low profitability and high investment. And they have higher disagreement among analyst forecasts (another anomaly).
Summary
The academic literature provides us with many anomalies to the efficient markets hypothesis. These anomalies can persist well after publication due to behaviors that create the anomalies persisting and due to limits to arbitrage which prevent sophisticated investors from correcting mispricings. Long only mutual funds and ETFs (both active and passive) can exploit these anomalies by screening out stocks with the negative characteristics.
About the Author: Larry Swedroe
—
Important Disclosures
For informational and educational purposes only and should not be construed as specific investment, accounting, legal, or tax advice. Certain information is deemed to be reliable, but its accuracy and completeness cannot be guaranteed. Third party information may become outdated or otherwise superseded without notice. Neither the Securities and Exchange Commission (SEC) nor any other federal or state agency has approved, determined the accuracy, or confirmed the adequacy of this article.
The views and opinions expressed herein are those of the author and do not necessarily reflect the views of Alpha Architect, its affiliates or its employees. Our full disclosures are available here. Definitions of common statistics used in our analysis are available here (towards the bottom).
Join thousands of other readers and subscribe to our blog.