In our book “Your Complete Guide to Factor-Based Investing,” Andrew Berkin and I provided evidence that among the hundreds of equity factors identified in the literature, there were only five that met our criteria for investment. The factor must have provided a premium that was: persistent across long periods and different economic regimes; pervasive across countries, regions, sectors, and even asset classes; robust to various definitions; investable (it held up after implementation costs); and intuitive (there are logical risk-based or behavioral-based explanations for the premium, providing the rationale that it should continue to exist). The five that met the criteria were market, size, value, momentum, and profitability/quality.
While the first four have generally accepted definitions, there needs to be a consensus about what constitutes a quality company. Among the traits typically used by practitioners to define a quality company are: low earnings volatility, low financial leverage, high gross profitability, high return on equity, low operating leverage, high asset turnover, low accruals (high earnings quality), low equity dilution, and low idiosyncratic stock risk. To capture the multiple dimensions of quality, practitioners commonly define it as a composite. For example, index providers such as MSCI and S&P offer quality indexes that are comprised of at least three underlying quality attributes.
The Role of Intangibles
The past decade has witnessed a dramatic increase in spending on intangibles (not just research and development and advertising expenditures but also expenses related to human capital) relative to capital expenditures on plants and equipment. Given the change, it is not surprising that researchers, including the authors of the 2020 studies “Explaining the Recent Failure of Value Investing,” “Intangible Capital and the Value Factor: Has Your Value Definition Just Expired?,” and “Equity Investing in the Age of Intangibles,” and the 2021 study “Value of Internally Generated Intangible Capital,” have focused on the impact on equity valuations and returns resulting from the change in the relative importance of intangible assets compared to physical assets.
The increasing role of intangibles is highlighted by the fact that R&D expenditures increased from 1% of company expenditures in 1975 to 7.5% in 2018, and that in 2015 services’ share of GDP was 74% in high-income countries and just under 69% globally. The authors of each of the studies above found that the increasing importance of intangibles, at least for industries with high concentrations of intangible assets, plays an essential role in the cross-section of returns and thus should be addressed in portfolio construction. Not accounting for intangibles affects value metrics but and other measures (such as profitability) that often scale by book value or total assets, both of which are affected by intangibles—and investors recognize at least some of their value.
Given that profitability is one of the key metrics defining quality, an interesting question is: Can intangibles be used to improve the performance of the quality factor? The Vanguard Group’s Mattia Bacciardi, Haifeng Wang, Jishan Mei, and Miao Yang sought the answer in their March 2023 study “Intangibles as a Quality Attribute,” in which they examined whether accounting for intangible intensity could improve the returns to the quality factor. They began by noting: “Intangibles can be defined as all the costs incurred by a firm to sustain or enhance its business operations and hence are expensed in the firm’s income statement but are de facto ‘investments’ or ‘assets’ in an economic sense as they contribute to the company’s future operating performance and profitability. This broad definition of intangible capital encompasses both traditional items such as R&D and software expenses as well as costs whose financial impact is harder to quantify such as those associated with brand equity (marketing and advertising), organizational capital (training and new process improvements) and human capital (talent acquisition and retention, development and up-skilling). These assets are not easily replicated by competitors, which gives the company a competitive advantage. They are often associated with the quality of a company’s management and its ability to innovate and create value. Companies with high-quality management teams and a culture of innovation are more likely to create valuable intangible assets. In other words, higher intangible assets can be a channel that translate company’s daily investment and expense to a company’s long competitive strength, innovation, and customer relationships. They can often be more valuable in the long run and help differentiate a company from its competitors.” That led them to blend intangible asset intensity (IAI) with other established quality attributes.
Their investment universe was the Russell 3000, with data covering from January 1992 through September 2022. They removed the most illiquid microcap stocks to make the remaining universe investible. They also eliminated utility and real estate stocks from their analysis. For each company in the sample, they built an intangible intensity attribute defined as:
????????????????,???? = (????????????????,????+ ????????????????,????)/ (????????????????,????+ ????????????????,???? + ????????????,????)
- ????????????????,???? (knowledge capital intensity): obtained from capitalizing the total R&D expenses every year and straight-line depreciating them over five years for company ???? at time ????.
- ????????????????,???? (organizational capital intensity): formed by capitalizing 30% of the yearly selling, general, and administrative expenses (SGA) and depreciating them over five years for company ???? at time ????.
- ????????????,???? (total asset) is the total asset for company ???? at time ????.
In calculating the IAI scores, they first sorted stocks into three size groups: large, mid, and small groupings containing the 200 largest stocks, 800 midcap stocks, and 2,000 small stocks. They then calculated the signal of IAI based on their percentiles within each of the size groups. Following is a summary of their key findings:
IAI is an important attribute in building an investible quality portfolio, one that is not fully captured by financial analysts and existing risk factors—producing a premium that was statistically significant at the 1% confidence level.

The results are hypothetical results and are NOT an indicator of future results and do NOT represent returns that any investor actually attained. Indexes are unmanaged and do not reflect management or trading fees, and one cannot invest directly in an index.
- The IAI spread was a statistically significant predictor after controlling for sectors—most sectors demonstrated an IAI premium.
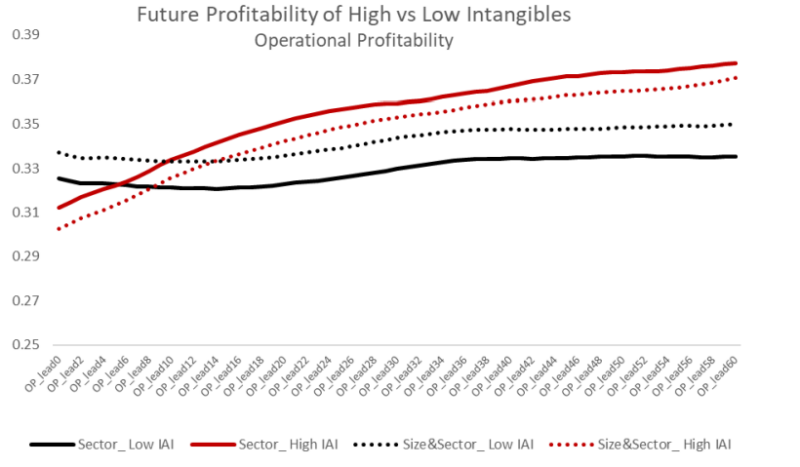
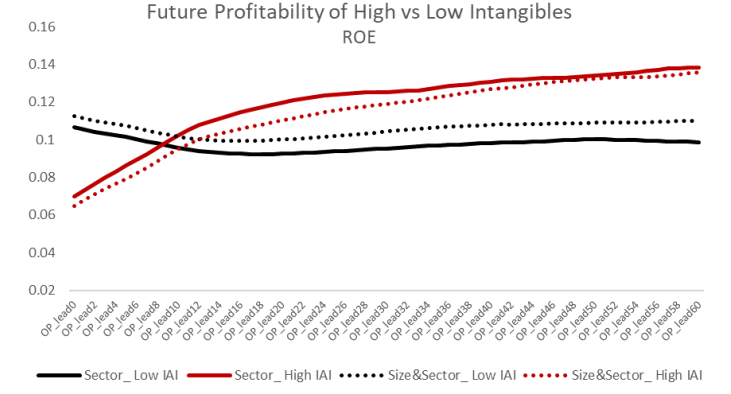
- There was a correlation between the current IAI level and the future level of operational profitability and return on equity.

The results are hypothetical results and are NOT an indicator of future results and do NOT represent returns that any investor actually attained. Indexes are unmanaged and do not reflect management or trading fees, and one cannot invest directly in an index.

The results are hypothetical results and are NOT an indicator of future results and do NOT represent returns that any investor actually attained. Indexes are unmanaged and do not reflect management or trading fees, and one cannot invest directly in an index.
- Adding IAI improved analyst earnings estimates. The relationship was significant at the 1% level after controlling for market cap, gross profitability, and sector exposure over the entire sample period.
- Adding IAI enhanced the quality portfolio, generating higher returns with less risk.

The results are hypothetical results and are NOT an indicator of future results and do NOT represent returns that any investor actually attained. Indexes are unmanaged and do not reflect management or trading fees, and one cannot invest directly in an index.
- The IAI premium was not sector dependent—IAI returned a statistically significant positive premium in Fama-MacBeth regressions after controlling for sector exposures.
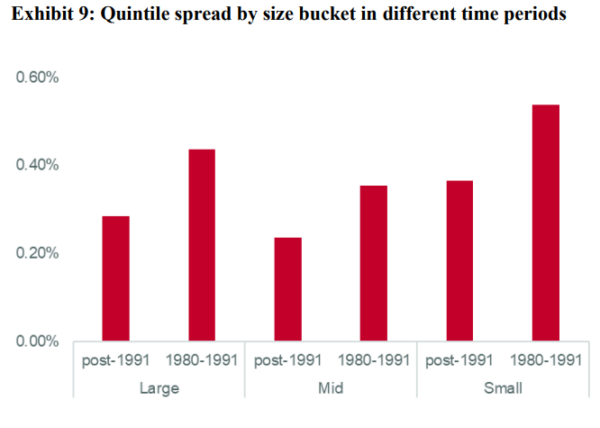
- The IAI premium was not confined to the most recent period or a specific segment of the capitalization spectrum.
To address the concern that the IAI premium could have resulted from specific macroeconomic or financial conditions, such as the long equity rally and the meager rates environment following the Great Financial Crisis, the authors extended their data to 1980, covering a period when inflation and rates were high with different market conditions. They found that the IAI spread was statistically significant and positive across the large, mid, and small buckets in all periods.

The results are hypothetical results and are NOT an indicator of future results and do NOT represent returns that any investor actually attained. Indexes are unmanaged and do not reflect management or trading fees, and one cannot invest directly in an index.
Their findings led Bacciardi, Wang, Mei, and Yang to conclude: “Intangibles represent an important dimension of quality that is related to a company’s ability and willingness to accumulate and retain intangible capital.” They added: “By incorporating IAI with other commonly used quality attributes, such as gross and operating profitability and change of net operating capital, our findings suggest that the new quality portfolio could be improved by the inclusion of companies with high intangibles. The new quality portfolio exhibits a better risk-return profile and a more desirable factor exposure.” It will be interesting to see if practitioners incorporate Vanguard’s findings into the construction rules.
Larry Swedroe is head of financial and economic research for Buckingham Wealth Partners.
For informational and educational purposes only and should not be construed as specific investment, accounting, legal, or tax advice. Certain information is based on third party data and may become outdated or otherwise superseded without notice. Third party information is deemed to be reliable, but its accuracy and completeness cannot be guaranteed. By clicking on any of the links above, you acknowledge that they are solely for your convenience, and do not necessarily imply any affiliations, sponsorships, endorsements or representations whatsoever by us regarding third-party websites. We are not responsible for the content, availability or privacy policies of these sites, and shall not be responsible or liable for any information, opinions, advice, products or services available on or through them. Neither the Securities and Exchange Commission (SEC) nor any other federal or state agency have approved, determined the accuracy, or confirmed the adequacy of this article. LSR-23-481
About the Author: Larry Swedroe
—
Important Disclosures
For informational and educational purposes only and should not be construed as specific investment, accounting, legal, or tax advice. Certain information is deemed to be reliable, but its accuracy and completeness cannot be guaranteed. Third party information may become outdated or otherwise superseded without notice. Neither the Securities and Exchange Commission (SEC) nor any other federal or state agency has approved, determined the accuracy, or confirmed the adequacy of this article.
The views and opinions expressed herein are those of the author and do not necessarily reflect the views of Alpha Architect, its affiliates or its employees. Our full disclosures are available here. Definitions of common statistics used in our analysis are available here (towards the bottom).
Join thousands of other readers and subscribe to our blog.

