The research team at Verdad does some of the most interesting and innovative empirical financial research that is consistently rigorous and based on systematic approaches that are implementable and replicable, providing confidence in the findings.
In a recent piece, “Analogous Market Moments,” they focused on how macroeconomic signals can help predict expected returns across asset classes.
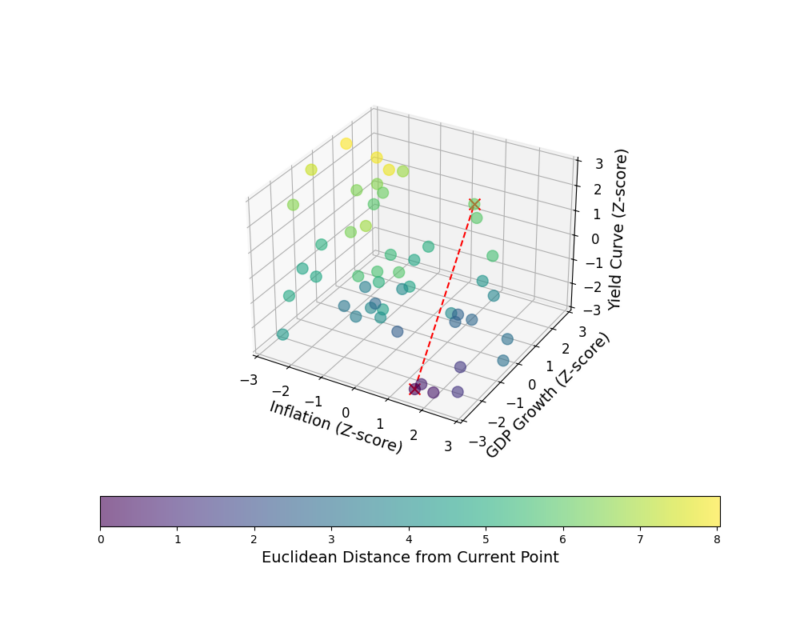
“We created a measure of macroeconomic similarity that incorporates the full range of predictive economic signals that we rely on like high-yield spreads, inflation, stock-bond correlation, and the yield curve. We converted the economic data at each point into a vector (a vector is a multi-dimensional mathematical object that represents a list of data points in a specific order. Each vector is defined by its components, which can be used to uniquely identify its position in a multi-dimensional space). To measure how extreme each observation is, we calculate the distance between that vector and all historical vectors. This distance measurement is known as the Euclidean distance.”
The following chart illustrates how they measure the distance between two hypothetical months, using only interest rates, inflation, and GDP growth.
Their methodology enabled them to cluster similar market moments into “regimes” and examine potential implications for asset class returns in each regime.
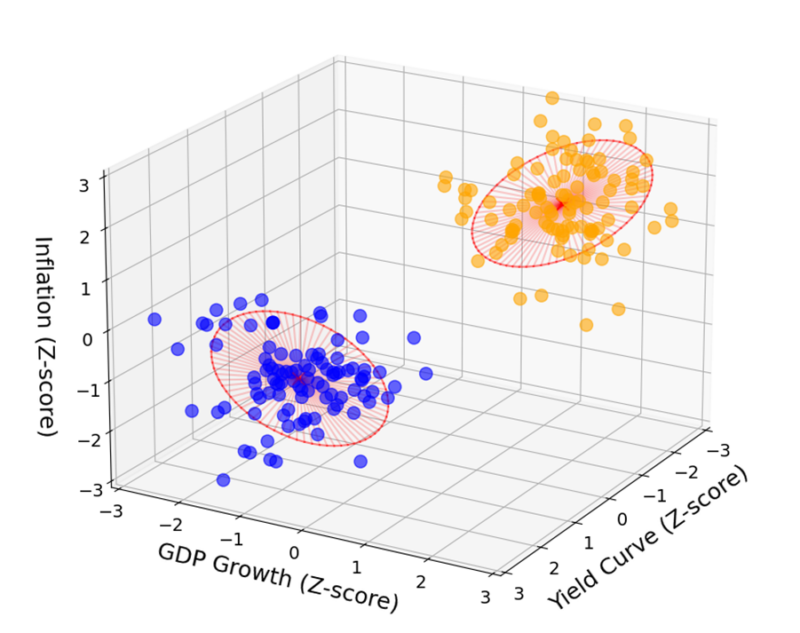
“We used an unsupervised clustering algorithm called a Gaussian mixture model (GMM) to fit distributions to our historical macro signals.”
In the following illustrative example from their paper “Classifying Economic Regimes,”, their model found two clusters of economic regimes: one defined by low GDP growth, low inflation, and an upward-sloping yield curve (blue), and another defined by high GDP growth, high inflation, and an inverted yield curve (orange).
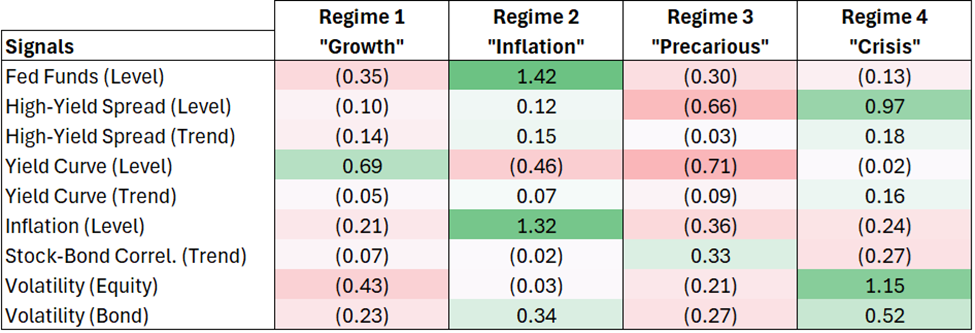
Applying GMM to all of their macro signals from 1962 to 2024 revealed four distinct economic regimes:
- Regime 1 (Growth): Defined by benign economic conditions—moderate rates, upward-sloping yield curve, subdued volatility, etc.
- Regime 2 (Inflation): Defined by high inflation, elevated rates, and high bond volatility.
- Regime 3 (Precarious): Defined by risk-taking behavior (compressed high-yield spreads), depressed volatility, a flat or inverted yield curve, and increasing stock-bond correlation.
- Regime 4 (Crisis): Defined by high risk aversion and significantly elevated volatility.
The figure below shows the average standardized signal in each regime.
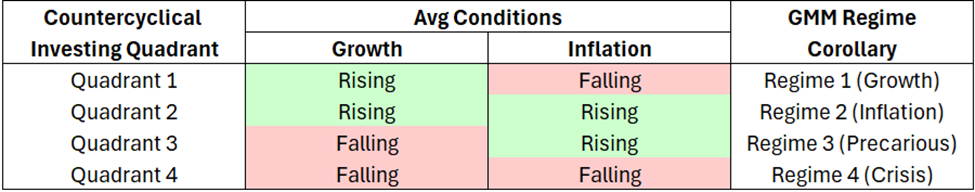
The following table shows the “Countercyclical Investing Economic Quadrant vs. Regime Corollary.”
They then were able to classify each time period into one of the four regimes and examine how the economy has cycled through these regimes over time.
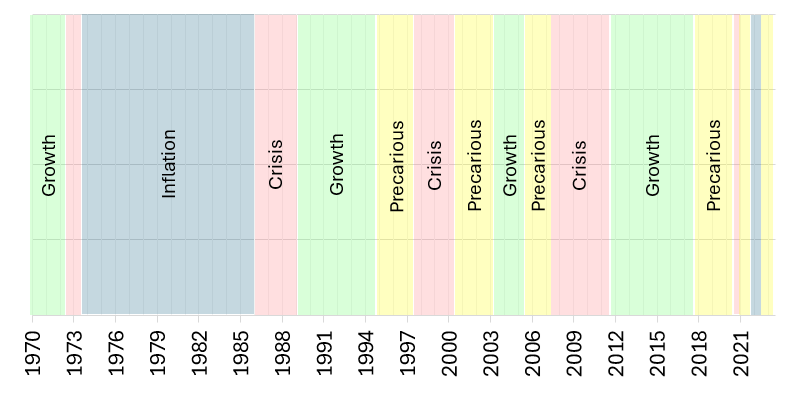
“The graph above seems to corroborate our classifications. The crisis regime correctly captures the inflationary 1970s, the tech bubble in the early 2000s, the financial crisis of ’08, and, most recently, COVID and the inflation spike that followed. As far as our current macro environment is concerned, we fit most closely with the precarious regime, similar to early 2007.”
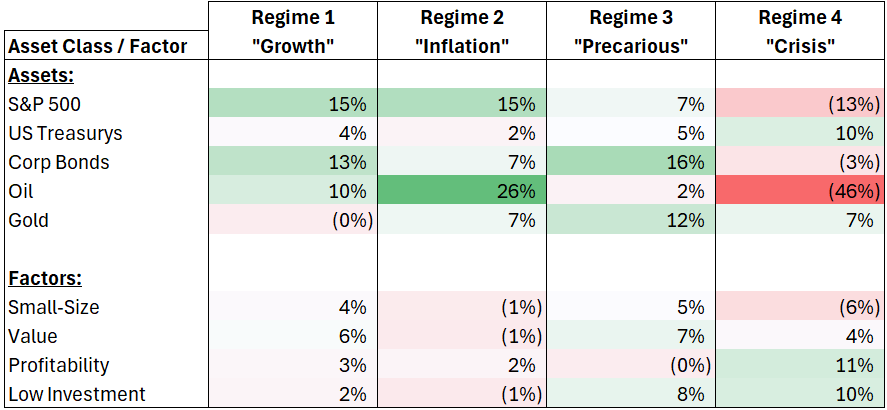
They then analyzed the average annualized return for various assets and factors in each regime.
Asset and Factor Returns by Regime (1970-2024)
The results are hypothetical results and are NOT an indicator of future results and do NOT represent returns that any investor actually attained. Indexes are unmanaged and do not reflect management or trading fees, and one cannot invest directly in an index.
Analyzing the relative best and worst performers in each regime they found:
- Regime 1 (Growth): equities, corporate bonds, and oil all do great. Smaller and cheaper companies do better here as well. Equities also did best in Quadrant 1.
- Regime 2 (Inflation): Oil excels here, along with the S&P 500. U.S. Treasurys do poorly, and most equity factors don’t work great.
- Regime 3 (Precarious): This is a bit of a mix, but most stuff does okay. Corporate bonds and gold do best.
- Regime 4 (Crisis): US Treasurys and gold do best. Oil and equities do terribly. Within equities, large companies with high profitability and low investment do better.
Investor takeaway
Knowing what economic regime we might be in won’t provide you with the crystal ball allowing you to foresee what geopolitical events will drive markets, whether “black swans” will appear, or identify whatever unexpected events or government policy actions will drive markets. With that said, it can help by providing a systematic approach for those who engage in dynamic portfolio allocation. It can also help investors to avoid the behavioral bias that can lead to concentrating in assets that happened to have performed best in the most recent period. It can also help to provide a framework to help estimate asset class returns.
Larry Swedroe is the author or co-author of 18 books on investing, including his latest Enrich Your Future.

About the Author: Larry Swedroe
—
Important Disclosures
For informational and educational purposes only and should not be construed as specific investment, accounting, legal, or tax advice. Certain information is deemed to be reliable, but its accuracy and completeness cannot be guaranteed. Third party information may become outdated or otherwise superseded without notice. Neither the Securities and Exchange Commission (SEC) nor any other federal or state agency has approved, determined the accuracy, or confirmed the adequacy of this article.
The views and opinions expressed herein are those of the author and do not necessarily reflect the views of Alpha Architect, its affiliates or its employees. Our full disclosures are available here. Definitions of common statistics used in our analysis are available here (towards the bottom).
Join thousands of other readers and subscribe to our blog.