Watch the video version of this blog here.
Raise your hand if you’re tired of hearing that “this year will be the year for international investing!” 🙋♂️
Since 2010, the S&P 500 has beaten the International Developed market in all but three years (2012, 2017 & 2022). This led the U.S. market to outperform International Developed by an astounding 8.14% compounded per year. Wowza! Talk about pain if you’re a global investor.

So what gives? What could possibly make international investing appealing in this day and age?
Sure, we could talk about U.S. market concentration and valuation concerns (which are real). Or we could highlight the potential diversification benefits of investing internationally. But a more compelling question to tackle is: “How did the U.S. market actually realize its astonishing relative outperformance?” The answer might offer clues about whether U.S. dominance is just inevitable or if diversifying overseas is the more attractive proposition.
Let’s dive in.
Theoretically, a market could go up for two reasons:
- Valuation repricing: Investors bid up prices. Even if earnings remain steady, valuations rise as demand increases.
- Better-than-expected fundamentals: Earnings increase.
For international investing, there’s one additional factor:
- Currency Effects: A rising dollar is bearish for foreign investments, while a falling dollar provides a tailwind for international assets.
Let’s examine each of these and determine how each of these affected the return gap between U.S. and international stocks.
Valuation repricing
When comparing U.S. outperformance to international markets, it’s tempting to assume fundamentals played the only role. But is that what actually happened?
Let’s ask the quants.
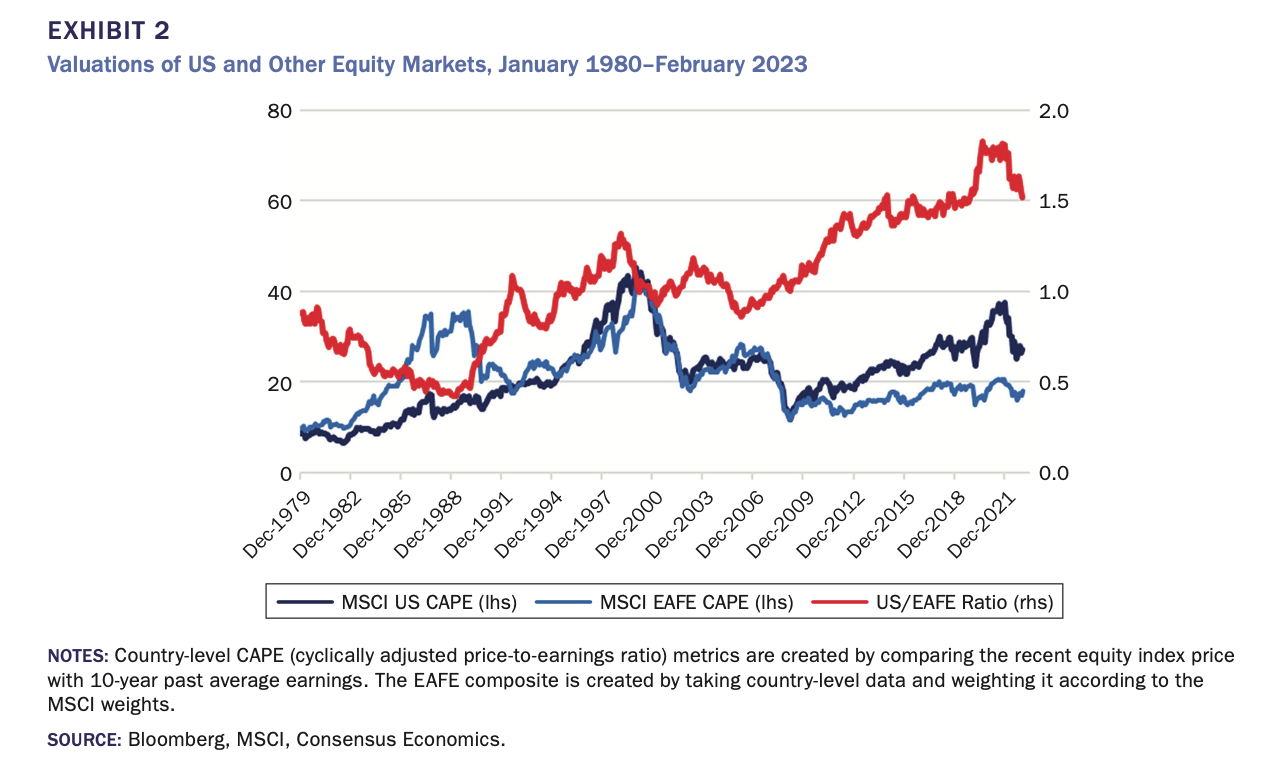
According to AQR’s Cliff Asness, Antti Ilmanen and Dan Villalon, U.S. outperformance over international developed from 1990 through 2022 can mostly be attributed to valuation expansion. In fact, richer valuations account for about three-quarters of the U.S.’s relative outperformance over international, while the rest can be attributed to fundamentals – or maybe just pure luck! Over this time period, U.S. stocks appreciated mainly because people were willing to pay more for the same earnings, not necessarily because of superior fundamental growth.1 Therefore, betting 100% of a portfolio on U.S. stocks is essentially a bet on unending optimism. A bold bet if you ask me!
Still, we have to give it to the U.S. I’d rather have my assets appreciate through multiple expansion than not at all.
US 1 – International 0
But I hear you. Obviously, not all the return differential came from multiple expansion. In fact, about 1.2% of the return differential cannot be accounted for by multiple expansion. Yeah, maybe it’s not statistically insignificant… But it’s definitely economically significant!
Let’s explore one plausible explanation behind this 1.2% (as noisy as it may be).
Earnings growth story
Multiple expansion seldom happens randomly. More often than not, fundamentals catalyze valuation revisions. So let’s look at the story behind earnings growth.
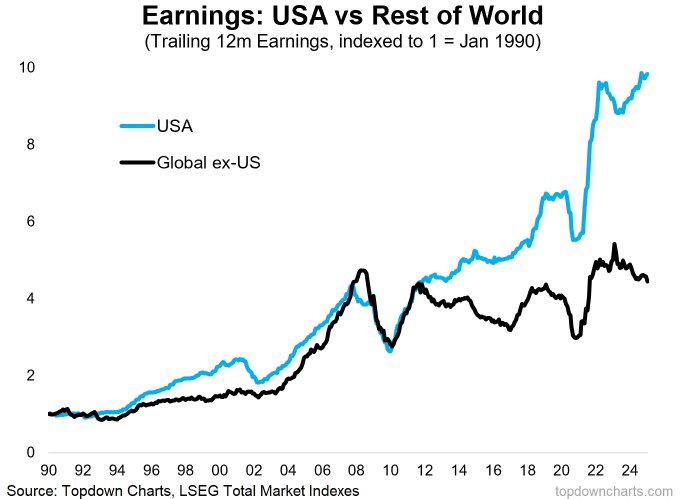
Source: Thomas, Callum. Earnings: USA vs Rest of World. January 8, 2025. Topdown Charts.
As you can see, starting around 2012, U.S. earnings began diverging from their international counterparts, and while regulatory and fiscal policy in the U.S. might have contributed to this differential, the concentration of stellar performers further skewed the numbers. Maybe these two things are related, maybe not, but at the end of the day, one thing is clear: U.S. growth left international investors in the dust.
US 2 – International 0
Should we then bet on the horse of U.S. growth dominance? No clear answer here, but at least historically, periods of abnormal growth have been followed by more moderate (or negative) periods of growth. After all, it’s pretty hard for things to keep going up indefinitely!
Let’s examine one last factor to this return differential.
Currency effects
Investing internationally is an implied bet against the U.S. dollar. When an investor buys an international asset, they must sell their U.S. dollars (forming an implied short position) and buy the local currency to purchase said security (establishing an implied long position).
So how has this bet paid off post-GFC?
Horribly! Once again, things did not pay off for international investors.
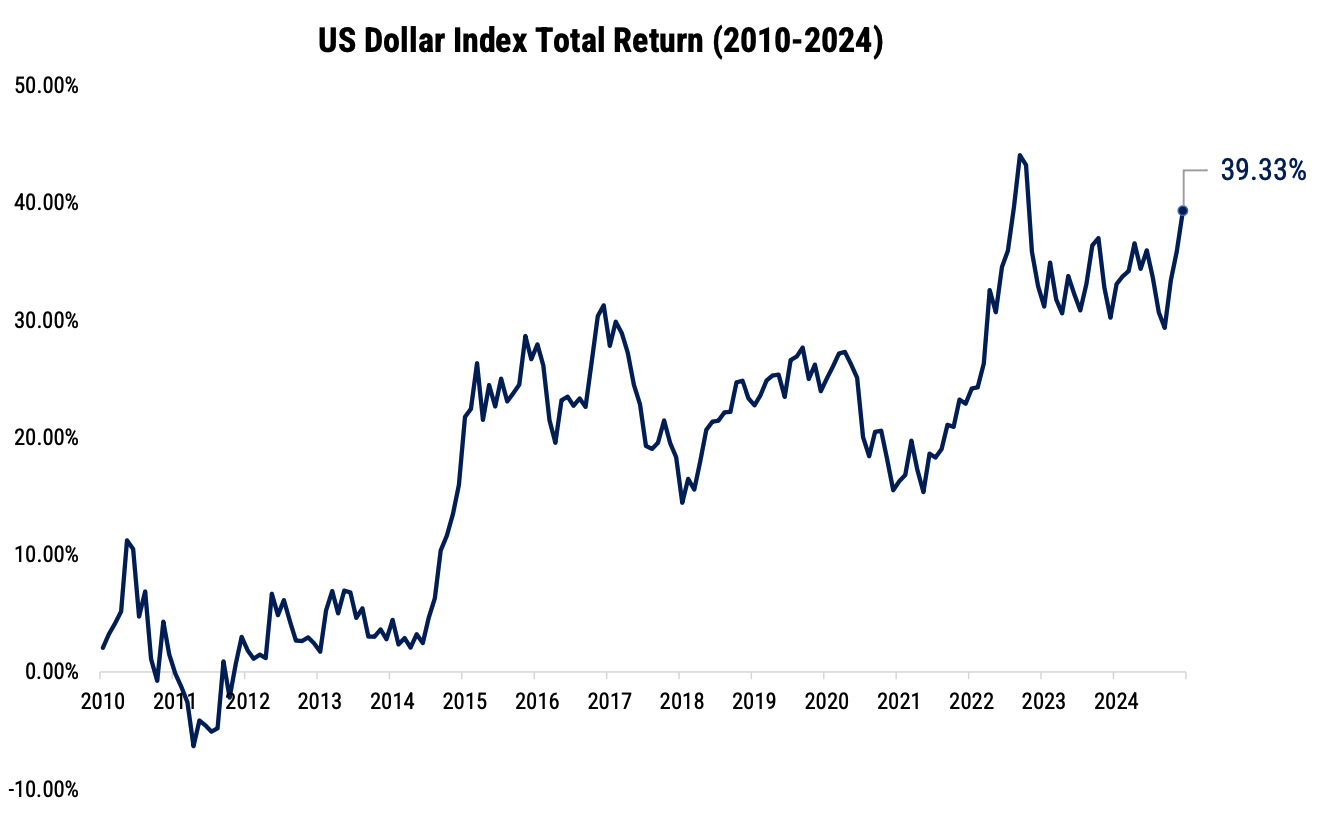
Looking at the dollar index, from January 2010 to December 2024, the USD realized a 39.33% return against a basket of other major currencies.
US 3 – International 0
Before deciding whether USD dominance is a trend or a fad, let’s analyze the two events that stand out from this chart:
- 2014: The dollar strengthened as the Fed announced interest rate hikes following a strong economy while most other central banks lagged.
- 2022: A strong inflationary shock forced the Fed into a hiking cycle. This, along with perceived weakness in Europe threatened by the Russia-Ukraine war, fueled USD demand.
These two events alone account for most USD gains since 2010! And they both have one big common denominator: Interest rate policy.
While uncovered interest rate parity would dictate that lower yielding currencies should appreciate over time, and higher yielding currencies should depreciate over time, this has not been historically true. In fact, higher yielding currencies have tended to appreciate over time as investors reach for yield, while lower yielding currencies have tended to depreciate as investors flock to higher interest rate currencies. Hence, carry trades are possible! Therefore, changes in interest rate policy may be predictive of future currency moves. All else equal, higher yielding currencies tend to appreciate, and lower yielding currencies tend to depreciate.
Importantly, while the U.S. central bank adopted a significantly more hawkish stance in the mid 2010’s, most other major central banks only began hiking until recently. This likely served as a strong tailwind to the dollar post-GFC. But should we expect this to repeat? Maybe, perhaps not. But let’s at least examine what interest rates are doing today.
Most notably, the Bank of Japan finally reversed its negative interest rate policy just last year (!) and signaled a willingness to continue its rate-hiking cycle. And though the European Central Bank has continued pursuing an accommodative monetary stance, the incoming Trump administration has also been vocal in its desire to lower interest rates. The main difference being that the U.S. is starting from a higher level and has much more “room” to drop.
All this could serve as a potential mean-reversion trigger for the U.S. dollar that may take years to unwind.
As always, currencies can be tricky, and macro predictions are a fool’s errand! Not to mention, trade balances, potential tariff wars, inflation and purchasing power differentials will most likely also influence future dollar moves (either up or down). Having said that, there are some legit reasons to believe that the dollar has headwinds ahead.
Conclusion
Where do we go from here?
To make a soccer analogy, clearly, this return differential has not resembled the Argentina (3) – France (3) 2022 World Cup final. It’s probably closer to the Brazil (1) – Germany (7) 2014 World Cup fiasco. The U.S. clearly trounced most other countries for over a decade!
But the question is not “what do I wish my portfolio would have looked like during that period?” It’s “what is the best evidenced-based decision I can make for my portfolio going forward?”
Investing 100% in the U.S. might make sense if:
- You expect the U.S. to keep getting pricier than other markets, indefinitely.
- You expect the U.S. to continue growing earnings at abnormally higher rates, indefinitely.
- You expect the U.S. dollar to trounce other currencies, indefinitely.
If not, then international investing surely does look appealing, at least from a diversification perspective.
So what can investors do based on this information?
Here are three options:
1. Stay 100% U.S.
If you believe U.S. stocks will keep crushing it, this is your move. But keep in mind: U.S. stocks are pricey and concentrated—both of which are serious headwinds to overcome. Did I mention this is a pretty bold strategy?
2. Go 100% International
Expecting U.S. valuations to mean-revert? This is your play. But remember, 10 years ago the U.S. was already the pricier option. Valuation-based timers missed out on a stellar decade. Ouch!
3. Diversify Globally
Not sure which region will win over the next decade? Target both! Diversification is the only free lunch in investing, after all. Whether the U.S. keeps dominating or international markets stage a comeback, you’ll be prepared for either scenario.
Spoiler alert, we believe #3 looks like the most sensible option. After all, prudent investing relies on following the evidence – and as presented, it surely looks like international diversification has its place in most portfolios.
- “In 1990, US equity valuations (using Shiller CAPE) were about half that of EAFE; at the end of 2022, they were 1.5 times EAFE. Once you control for this tripling of relative valuations, the 4.6% return advantage falls to a statistically insignificant 1.2%.” – International Diversification – Still Not Crazy After All These Years (2023), Asness, Ilmanen and Villalon. ↩︎

About the Author: Jose Ordonez
—
Important Disclosures
For informational and educational purposes only and should not be construed as specific investment, accounting, legal, or tax advice. Certain information is deemed to be reliable, but its accuracy and completeness cannot be guaranteed. Third party information may become outdated or otherwise superseded without notice. Neither the Securities and Exchange Commission (SEC) nor any other federal or state agency has approved, determined the accuracy, or confirmed the adequacy of this article.
The views and opinions expressed herein are those of the author and do not necessarily reflect the views of Alpha Architect, its affiliates or its employees. Our full disclosures are available here. Definitions of common statistics used in our analysis are available here (towards the bottom).
Join thousands of other readers and subscribe to our blog.