The Causal Effect of Limits to Arbitrage on Asset Pricing Anomalies
- Chu, Hirshleifer and Ma
- A version of the paper can be found here.
- Want a summary of academic papers with alpha? Check out our Academic Research Recap Category.
Abstract:
We examine the causal effect of limits to arbitrage on ten well-known asset pricing anomalies using Regulation SHO, which reduced the cost of short selling for a random set of pilot stocks, as a natural experiment. We find that the anomalies become substantially weaker on portfolios constructed with pilot stocks during the pilot period. Regulation SHO reduces the anomaly long-short portfolio returns by 77 basis points per month, which survives risk adjustment with the Fama-French three-factor model. The effect comes only from the short legs of the anomaly portfolios.
Alpha Highlight:
The behavioral finance literature documents that the credibility of asset pricing anomalies depends on the researchers ability to identify 1) the source of mispricing (e.g., investor bias) and 2) the limits to arbitrage (why aren’t smart investors exploiting the mispricing). We explain this in detail via our sustainable active investing framework. Many academic papers put a lot of emphasis on understanding the behavioral bias component of this equation and spend less time understanding the limits to arbitrage. This paper is a bit different. In line with most behavioral finance researchers, Chu, Hirshleifer and Ma hypothesize that limits to arbitrage play an important role in generating anomalies. In particular they address how short sale constraints affect anomalies.
First some background on short selling. After the Great Depression the SEC adopted the “uptick rule,” which controls short selling during market breaks. Under this rule, short selling is only allowed at a price above the last traded price of a stock. 70 years later, the SEC considered loosening short sale constraints, specifically by eliminating the “uptick rule.” But does such behavior affect the stock market? To assess the effects of the rule change, the SEC began a temporary pilot program in early 2000:
- The pilot program of Regulation SHO: This pilot program took effect from May 2, 2005 to April 28 2006. During this period, the SEC randomly selected a group of stocks from the Russell 3000, referred to as “pilot stocks.” It removed the “uptick rule” on these “pilot stocks,” while the “non-pilot stocks” remained subject to the “uptick rule.” The purpose of the program was to “study the effects of relatively unrestricted short selling on market volatility, price efficiency, and liquidity.”
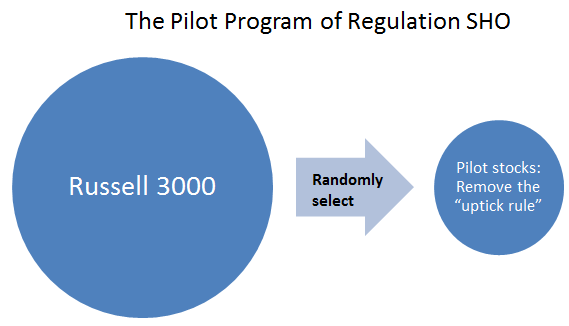
Note that when the program ended, the SEC decided to cancel the old uptick rule. Shortly thereafter, the US encountered the 2008 financial crisis. In Feb, 2010, the SEC adopted a new short sale price test restriction (“Alternative uptick rule”). Click the image above to learn more about Regulation SHO, short sale restrictions, and “Alternative uptick rule.”
This paper uses data from the pilot program to serve as a natural experiment to identify how loosening arbitrage constraints (i.e., short-selling capabilities and costs) affects asset pricing anomalies.
Below are two of the main hypotheses from the paper:
- Hypothesis 1: A loosening of short sale constraints leads to easier arbitrage. Anomalies should become weaker for pilot firms relative to non-pilot firms during the pilot period.
- Hypothesis 2: The effect of short selling on anomalies should come mostly from the short side of the anomaly (most anomalies are formed via long/short hedged portfolios).
Key Findings:
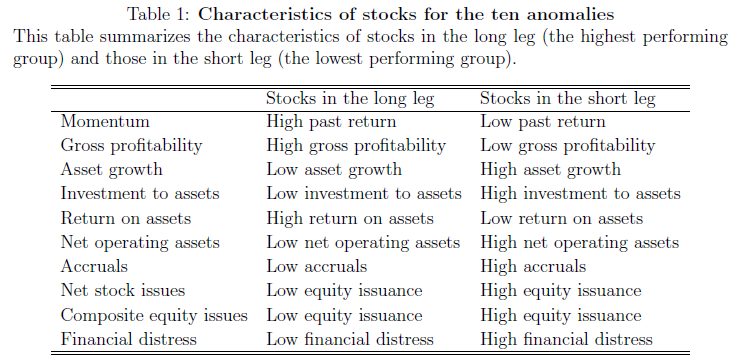
The authors choose 10 well-known anomalies from the literature: momentum, gross profitability, asset growth, investment to assets, return on assets, net operating assets, accruals, net stock issuance, composite equity issuance, and financial distress. They construct Long/short portfolios with pilot and non-pilot stocks separately.
The 10 anomalies are described in a paper Jack and I wrote a few years ago, here are the details:
- Financial distress (DISTRESS). Campbell, Hilscher, and Szilagyi (2007) find that firms with high failure probability have lower subsequent returns. Their methodology involves estimating a dynamic logit model with both accounting and equity market variables as explanatory variables. Investors systematically underestimate the predictive information in the Campbell, Hilscher, and Szilagyi model, which is shown to predict future returns. DISTRESS is computed similar to Campbell, Hilscher, and Szilagyi (2007).
- Net stock issuance (NETISS). Ritter (1991) and Loughran and Ritter (1995) show that, in post-issue years, equity issuers under-perform matching non-issuers with similar characteristics. The evidence suggests that investors are unable to identify that firms prefer to raise capital by issuing stock when equity prices are overvalued. We measure net stock issues as the growth rate of the split-adjusted shares outstanding in the previous fiscal year.
- Composite Equity Issuance (COMPISS). Daniel and Titman (2006) study an alternative measure, composite equity issuance, defined as the amount of equity a firm issues (or retires) in exchange for cash or services. They also find that issuers under-perform non-issuers because investors overlook the signals from repurchases and issuance. We measure COMPISS similar to Daniel and Titman (2006).
- Total accruals (ACCRUAL). Sloan (1996) shows that firms with high accruals earn abnormal lower returns on average than firms with low accruals. This anomaly exists because investors overestimate the persistence of the accrual component of earnings. Total accruals are computed using the same methodology as Sloan (1996).
- Net operating assets (NOA). Hirshleifer, Hou, Teoh, and Zhang (2004) find that net operating assets, defined as the difference on the balance sheet between all operating assets and all operating liabilities scaled by total assets, is a strong negative predictor of long-run stock returns. Investors are unable to focus on accounting profitability while neglecting information about cash profitability. NOA is computed using the methodology in Hirshleifer, Hou, Teoh, and Zhang (2004).
- Momentum (MOM). The momentum effect was first documented by Jagadeesh and Titman (1993). We calculate the momentum ranking monthly by looking at the cumulative returns from month -12 to month -2 similar to Fama and French (2008).
- Gross profitability premium (GP). Novy-Marx (2010) discovers that sorting on gross profit-to-assets creates abnormal benchmark-adjusted returns, with more profitable firms having higher returns than less profitable ones. Novy-Marx argues that gross profits divided by total assets is the cleanest accounting measure of true economic profitability and that investors overlook the investment value of the profitability of the firm. Gross profitability premium is measured by gross profits (REVT – COGS) scaled by total assets (AT).
- Asset growth (AG). Cooper, Gulen, and Schill (2008) find companies that grow their total asset more earn lower subsequent returns. The authors argue that investors overestimate future growth and business prospects based on observing a firm’s asset growth. Asset growth is measured as the growth rate of the total assets (AT) in the previous fiscal year.
- Return on assets (ROA). Fama and French (2006) find that more profitable firms have higher expected returns than less profitable firms. Chen, Novy-Marx, and Zhang (2010) show that firms with higher past return on assets earn abnormally higher subsequent returns. Investors appear to underestimate the importance of ROA. ROA is computed as income before extraordinary items (IB) divided by lagged total assets (AT).
- Investment-to-assets (INV). Titman, Wei, and Xie (2004) and Xing (2008) show that higher past investment predicts abnormally lower future returns. The authors posit that this anomaly stems from investor’s inability to identify manager empire-building behavior via investment patterns. Investment-to-assets is measured as the annual change in gross property, plant, and equipment (PPEGT) plus the annual change in inventories (INVT) scaled by the lagged total assets (AT).
Their results support both hypotheses:
- Anomalies are much weaker in long/short portfolios constructed using pilot stocks than using non-pilot stocks. When the 10 anomalies are combined, the pilot program reduces the monthly anomaly returns by 77 bps per month, or 9.24% per year, on average.
- The results also show that the decrease in anomaly returns come almost entirely from the short leg of the portfolio.
Fascinating!

About the Author: Wesley Gray, PhD
—
Important Disclosures
For informational and educational purposes only and should not be construed as specific investment, accounting, legal, or tax advice. Certain information is deemed to be reliable, but its accuracy and completeness cannot be guaranteed. Third party information may become outdated or otherwise superseded without notice. Neither the Securities and Exchange Commission (SEC) nor any other federal or state agency has approved, determined the accuracy, or confirmed the adequacy of this article.
The views and opinions expressed herein are those of the author and do not necessarily reflect the views of Alpha Architect, its affiliates or its employees. Our full disclosures are available here. Definitions of common statistics used in our analysis are available here (towards the bottom).
Join thousands of other readers and subscribe to our blog.