Mutual funds and ETFs whose main directive is index replication incur adverse selection costs from responding to changes in the composition of the stock market because indices rebalance in response to composition changes (due to IPOs, delistings, additions, deletions, new seasoned issuance, and buybacks) to maintain a value-weighted portfolio. While this approach successfully tracks the index, it effectively buys at high prices and sells at low prices, adversely affecting fund performance.
The Hidden Costs of Index Replication
Marco Sammon and John Shim, authors of the January 2025 study on Index Rebalancing and Stock Market Composition: which examined the impact of trading costs that result from the reconstitution of an index. To assess the rebalancing portfolio’s effect on fund returns, they constructed a “counterfactual index fund” that was meant to track a value-weighted total market index and varied the rebalancing from as short as daily to as long as four years. Their data sample spanned the period 1981-2023. Following is a summary of their key findings:
- As expected, index funds rebalance predictably in response to stock-level changes in shares outstanding, by systematically buying stocks of firms that issue and selling shares of firms that engaged in buybacks. They also scale down or up existing holdings to raise money to buy recent IPOs, or to put money from dropped stocks to work.
- Despite rebalancing volume representing less than 10% of overall index fund AUM, adverse selection costs are large enough that they show up in fund-level returns.
- A simple adjustment to the way stock indices rebalance—going from quarterly rebalancing to annual rebalancing—would yield an additional 25 basis points (bps) per year to index fund investors (depending on the decade it varied from -2 bps to 51 bps per year.
- The annual returns were monotonically decreasing as the rebalancing horizon became shorter. At the two extremes, the four-year rebalancing strategy outperformed the monthly strategy by 78 bps per year.
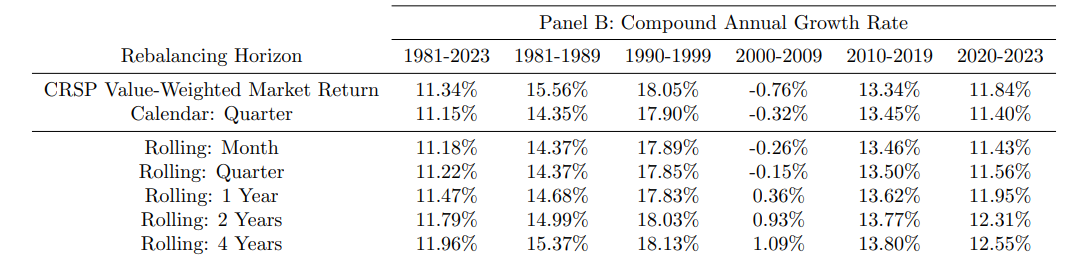
The results are hypothetical results and are NOT an indicator of future results and do NOT represent returns that any investor actually attained. Indexes are unmanaged and do not reflect management or trading fees, and one cannot invest directly in an index.
To test whether and the degree to which index funds are exposed to adverse selection Sammon and Shim constructed a long-short rebalancing portfolio that captured the buying and selling index funds do to maintain a constant ownership ratio. They found:
- Rebalancing portfolios had a -4% average annual return and a -2.8% annual alpha with respect to the Fama-French 5 factors, the momentum factor, and the short-term reversal factor.
- The change from the -4% annual return to -2.8% alpha came from negative loadings on the value factor (HML) and the profitability factor (RMW), suggesting that index fund rebalancing leads to buying growth stocks and stocks with weak profitability while selling value stocks and stocks with robust profitability.
- The addition/deletion portfolio had an economically large and statistically significant negative average annual return of -5.5%, though it had a statistically insignificant alpha.
- The scaling portfolio, which represents predicted scaling up and down of positions in response to investor flows, had an average return and alpha indistinguishable from zero. Thus, trading in response to flows is unlikely to be subject to the adverse selection concerns of buying the stocks in an index which issue the most equity, as flows lead all positions to scaled proportionally.
Of interest is that while index replicating funds buy stocks that issue new shares, it goes against empirical research (for example, on equity issuance and market underreaction) demonstrating that firms act on their beliefs of their own share price—firms may issue more shares when they think their share price is high. The new issuance causes shares outstanding to increase and index funds to subsequently buy. Similarly, firms may engage in repurchases when they think their share price is low. The repurchases cause shares outstanding to shrink and index funds subsequently sell.
Sammon’s and Shim’s findings led them to conclude:
“Index funds mechanically trade in response to IPOs and net issuance in a way that exactly exposes them to adverse selection by firms who buy back when prices are low and IPO/issue when prices are high. And even though this trading is small relative to the total value of index funds’ portfolios (less than 10% of AUM a year), these trades predict significant underperformance.” They added: “Index funds’ returns could generally be increased if they rebalanced less frequently or reactively.”
Supporting Evidence
Sammon’s and Shim’s findings are supported by those of Kaitlin Hendrix, Jerry Liu, and Trey Roberts, authors of the September 2024 study “Measuring the Costs of Index Reconstitution: A 10-Year Perspective,” who measured the costs of index reconstitution from 2014 to 2023 for 10 US indices. In their analysis, they restricted adds and deletes to nonmigrating securities, i.e., stocks that are added to (or deleted from) an index and are not also deleted from (or added to) another index from the same index family on the same reconstitution date. By focusing on these “pure” additions and deletions, they were able to more cleanly identify the cost of demanding immediacy associated with tracking an index. They examined the reconstitution events for 10 widely tracked US equity indices—the S&P 500 index, S&P MidCap 400 (S&P 400) index, S&P SmallCap 600 (S&P 600) index, Russell 1000 Growth Index, Russell 1000 Value Index, Russell 2000 Index, CRSP US Large Cap Growth Index, CRSP US Large Cap Value Index, CRSP US Mid Cap Index, and CRSP US Small Cap Index—from 2014 through 2023. Their sample included a total of 3,488 additions and 2,517 deletions.
Following is a summary of their key findings:
- There is abnormally high trade volume on reconstitution dates for stocks added to or deleted from the indices.
- Consistent with fund managers trying to minimize tracking error, the spike in trade volume tends to be highly concentrated at the time of market close on reconstitution dates—ranging from 3 times for the CRSP US Mid Cap Index to over 27 times for the S&P 500 index.
- The typical span between the last trade and the closing auction is 10 seconds or less and there is a strong price reversal for those stocks by market open the following morning.
- For the S&P indices, the S&P 600 exhibited the greatest volume increase, at around 112x trading volume at 4 pm on reconstitution day in rebalanced stocks compared to the trading volume in the same stocks during the same 15-minute window averaged over the prior month.
- The greatest volume pressure occurred for the Russell 2000 Index, with 120 times volume on rebalance day compared to the prior month.
- Additions rise in price relative to the index before rebalancing, while deletes fall in price. After reconstitution, both adds and deletes experience price reversals, with the effect being greater for adds on average.
- Over the period 2019-2023, price for additions on average went up by 9 bps, relative to nonrebalanced stocks, in the roughly 10 seconds between 4 pm on reconstitution day and market close and then reversed by a relative –13 bps by market open the next morning.
- On average, the price for deletions fell relative to nonrebalanced stocks by 30 bps from 4 pm to market close on reconstitution day, just before they were “sold” from the index, with a reversal of a relative 63 bps by market open the following day.
- On average prices moved adversely for additions/deletions by more than 4% over the 20 trading days leading up to reconstitution, with a reversal of –5.7% in the next month.
Their findings led Hendrix, Liu, and Roberts to conclude:
“With respect to transaction costs, adhering to an index reconstitution schedule can result in relatively poor execution prices—buying higher and selling lower—which are in turn reflected in investors’ returns.”
Investor Takeaways
While media, academic, and advisor scrutiny on index funds has focused on expense ratios and management fees to investors, the empirical research we have reviewed shows that the (hidden) costs of index construction and rebalancing policies to investors are about 10 times the expense ratios. For example, while Vanguard’s S&P 500 ETF (VOO) has an expense ratio of just 3bps, the Sammon and Shim found that because most index funds rebalance quarterly, the fund loses about 10 times that versus what an annual rebalancing strategy would do. For those interested, in the post-script I discuss other weaknesses (besides the cost of forced trading) of index replicating funds.
Post-Script
Most investors are unaware that there are weaknesses of index funds that result from their strategy to replicate the return of an index. Those weaknesses, which result from the desire to minimize what is called “tracking error” (returns that deviate from the return of the benchmark index), can lead to constraints and implementation costs that hurt returns. The weaknesses that can be minimized or avoided include:
- Sensitivity to risk factors varies over time, subjecting investors to unintentional style drift. Because indexes typically reconstitute annually, they lose exposure to their asset class/factor over time, as stocks migrate across asset classes during the course of a year. For example, according to a 2024 study by Dimensional Fund Advisors, on average from 2010 through June 2023, roughly 25% of the Russell 2000 Index, positioned as a small cap index, was composed of the largest 1,000 stocks in the Russell 3000 Index. Similarly, the overlap between the Russell 1000 Value and Growth indices averaged about 300 companies over that period. Non-index, but systematic, portfolios (like those of firms such as AQR, Avantis, Bridgeway, and Dimensional) typically reconstitute monthly, allowing them to maintain more consistent exposure to their asset class. That allows them to capture a greater percentage of the risk premiums in the asset classes in which they invest.
- Risk of exploitation through front-running. Active managers can exploit the knowledge that index funds must trade on certain dates. Systematic portfolios avoid this risk by not trading in a manner that simply replicates the return of the index, trading consistently throughout the year.
- Inclusion of all stocks in the index. Research has found that very low-priced (“penny”) stocks, stocks in bankruptcy, extreme small growth stocks with high investment and low profitability, and IPOs have poor risk-adjusted returns. A systematic portfolio could exclude such stocks, using a simple filter to screen them all out.
- Limited ability to pursue tax-saving strategies, including avoiding intentionally taking any short‐term gains and offsetting capital gains with capital losses.
- Robert D. Arnott, Chris Brightman, Vitali Kalesnik, and Lillian Wu, authors of the 2023 study “The Avoidable Costs of Index Rebalancing” found: “Capitalization-weighted indices generally add stocks with high valuation multiples after persistent outperformance and sell stocks at low valuation multiples after persistent underperformance.… Additions tend to be priced at valuation multiples more than four times as expensive as those of discretionary deletions…. It’s well known that the price impact of these changes can be large once a change is announced. The subsequent reversal is less well known. For example, in the year after a change in the S&P 500 Index, discretionary deletions beat additions by 22%, on average. Simple rules, such as trading ahead of index funds or delaying reconstitution trades by 3 to 12 months, can add up to 23 basis points a year.”
- Capital markets research shows that the mechanical buying of stocks immediately post-IPO by index funds leads to underperformance.
- Trade patiently in order to be a provider of liquidity to the market instead of a taker.
Another advantage of systematic funds, in return for accepting tracking error risk, is that they can gain greater exposure to the factors for which there is persistent and pervasive evidence of a return premium (such as size, value, momentum, profitability/quality, momentum, carry, and term). For example, a small-value fund could be structured to own smaller and more “valuey” (cheaper) stocks than a small-cap value index fund. It can also be structured to have more exposure to highly profitable companies, and it can screen for the momentum effect (avoiding buying stocks that are exhibiting negative momentum and delaying selling stocks with positive momentum).
Larry Swedroe is the author or co-author of 18 books on investing, including his latest Enrich Your Future.
About the Author: Larry Swedroe
—
Important Disclosures
For informational and educational purposes only and should not be construed as specific investment, accounting, legal, or tax advice. Certain information is deemed to be reliable, but its accuracy and completeness cannot be guaranteed. Third party information may become outdated or otherwise superseded without notice. Neither the Securities and Exchange Commission (SEC) nor any other federal or state agency has approved, determined the accuracy, or confirmed the adequacy of this article.
The views and opinions expressed herein are those of the author and do not necessarily reflect the views of Alpha Architect, its affiliates or its employees. Our full disclosures are available here. Definitions of common statistics used in our analysis are available here (towards the bottom).
Join thousands of other readers and subscribe to our blog.