Labor Hiring, Investment, and Stock Return Predictability in the Cross Section
- Frederico Belo, Xiaoji Lin, Santigo Bazdresch
- A version of the paper can be found here.
- Want a summary of academic papers with alpha? Check out our Academic Research Recap Category!
Abstract:
We study the impact of labor market frictions on asset prices. In the cross section of U.S. firms, a 10 percentage points increase in the firm’s hiring rate is associated with a 1.5 percentage points decrease in the firm’s annual risk premium. We propose an investment-based model with stochastic labor adjustment costs to explain this finding. Firms with high hiring rates are expanding firms that incur high adjustment costs. If the economy experiences a shock that lowers adjustment costs, these firms benefit the most. The corresponding increase in firm value operates as a hedge against these shocks, explaining the lower risk premium of these firms in equilibrium.
Data Sources:
1965-2010, CRSP/COMPUSTAT
Alpha Highlight:
Firms that have lower hiring rates have better stock returns.
The results are hypothetical results and are NOT an indicator of future results and do NOT represent returns that any investor actually attained. Indexes are unmanaged, do not reflect management or trading fees, and one cannot invest directly in an index. Additional information regarding the construction of these results is available upon request.
Strategy Summary:
- Tests the relationships between hiring, investment, and stock returns from 1965 to 2010.
- Hiring rate is computed as (net new hires) / (average number of employees over the past 2 years).
- Investment rate is computed as (CAPEX – sale of PPE) / (average net PPE over the past two year).
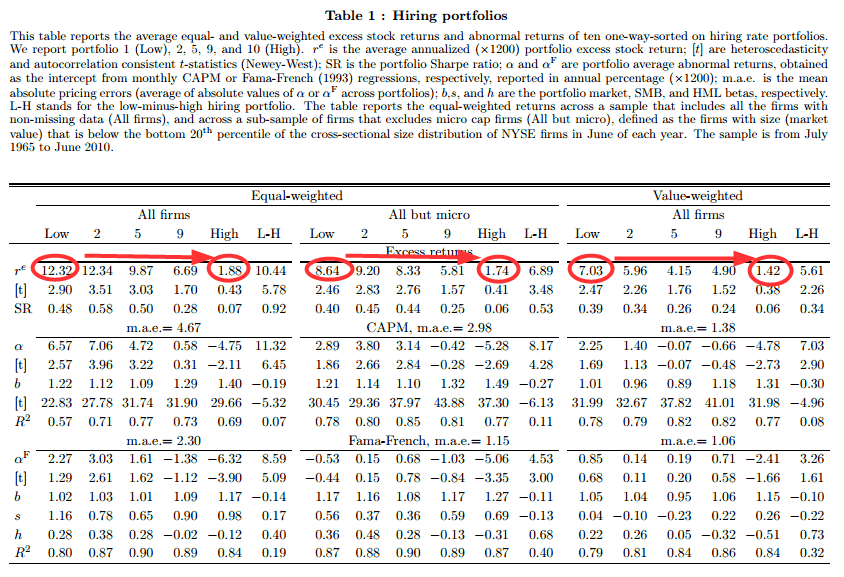
- Using the hiring rates described above, for decile portfolios and hold for a year.
- Firms in the bottom decile for hiring rate outperform the firms in the top decile for hiring rate.
- The spread is 10.44% (5.61%) when equal (value) weighting the portfolios, and a a L/S portfolio which goes long firms in the low hiring decile and short firms in the top hiring decile generates 8.59% (3.26%) three-factor alpha for EW (VW) portfolio.
- The EW return spread lowers from 10.44% to 6.89% when eliminating micro cap firms.
- Sharpe ratios of the portfolio of firms with low hiring rates is about 4-6 times larger than those with high hiring rates.
- Firms in the bottom decile for hiring rate outperform the firms in the top decile for hiring rate.
- Investment rate is also negatively correlated with future stock returns, as shown in previous research.
- Next create double-sorted portfolios (0-30, 30-70, 70-100 percentiles) based on both hiring and investment rates (to control for the impact of investment rates).
- When controlling for the investment rate (via the double sorts in Table 3), the main result holds that firms with lower hiring rates have higher returns than firms with higher hiring rates.
- Paper also creates a model to explain the results above.
Strategy Commentary:
- Given the importance of labor market fluctuations in business cycles, it is important to have an accurate understanding of adjustment cost shocks and learn to hedge against such shock.
- Most of the returns to the L/S trading strategy come from the short book, and these L/S returns (EW) diminish when eliminating micro-cap firms.
- This indicates that this may not be a profitable trading strategy, as the short book may be very costly to implement.
Watch out for companies posting on Monster.com!

About the Author: Wesley Gray, PhD
—
Important Disclosures
For informational and educational purposes only and should not be construed as specific investment, accounting, legal, or tax advice. Certain information is deemed to be reliable, but its accuracy and completeness cannot be guaranteed. Third party information may become outdated or otherwise superseded without notice. Neither the Securities and Exchange Commission (SEC) nor any other federal or state agency has approved, determined the accuracy, or confirmed the adequacy of this article.
The views and opinions expressed herein are those of the author and do not necessarily reflect the views of Alpha Architect, its affiliates or its employees. Our full disclosures are available here. Definitions of common statistics used in our analysis are available here (towards the bottom).
Join thousands of other readers and subscribe to our blog.