That is what Amaya, Christofferson, Jacobs, and Vasquez find.
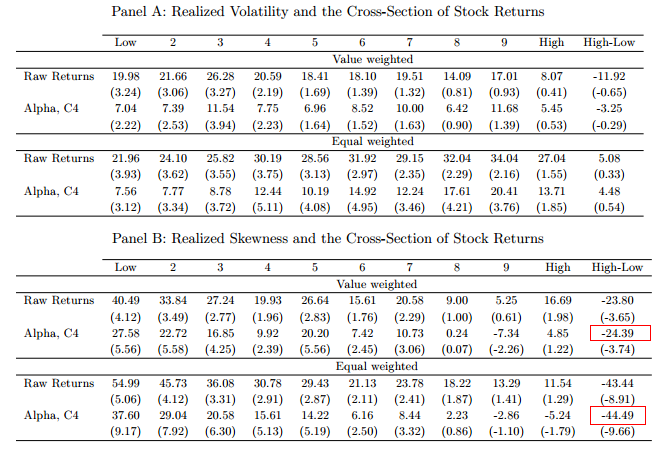
We use intraday data to compute weekly realized variance, skewness, and kurtosis for equity returns and assess whether this week’s realized moments are informative for the cross-section of next week’s stock returns. We sort stocks each week according to their realized moments, form decile portfolios, and analyze subsequent weekly returns. We find a very strong negative relationship between realized skewness and next weeks stock returns. A trading strategy that buys stocks in the lowest realized skewness decile and sells stocks in the highest realized skewness decile generates an average weekly return of 24 basis points with a t-statistic of 3:65. Our results on skewness are robust across a wide variety of implementations, unlike those for alternative skewness measures. They are also robust across sample periods, portfolio weightings, and firm characteristics, and are not captured by the Fama-French and Carhart factors. We find some evidence that the relationship between realized kurtosis and next week’s stock returns is positive, but the evidence is not always robust and statistically significant. We do not find a strong relationship between realized volatility and next week’s stock returns.
Here is the table with all the goodies:
The results are hypothetical results and are NOT an indicator of future results and do NOT represent returns that any investor actually attained. Indexes are unmanaged, do not reflect management or trading fees, and one cannot invest directly in an index. Additional information regarding the construction of these results is available upon request.

About the Author: Wesley Gray, PhD
—
Important Disclosures
For informational and educational purposes only and should not be construed as specific investment, accounting, legal, or tax advice. Certain information is deemed to be reliable, but its accuracy and completeness cannot be guaranteed. Third party information may become outdated or otherwise superseded without notice. Neither the Securities and Exchange Commission (SEC) nor any other federal or state agency has approved, determined the accuracy, or confirmed the adequacy of this article.
The views and opinions expressed herein are those of the author and do not necessarily reflect the views of Alpha Architect, its affiliates or its employees. Our full disclosures are available here. Definitions of common statistics used in our analysis are available here (towards the bottom).
Join thousands of other readers and subscribe to our blog.