The Momentum Gap and Return Predictability
- Simon Huang
- A version of the paper can be found here.
- Want a summary of academic papers with alpha? Check out our Academic Research Recap Category.
Abstract:
Momentum strategies have historically delivered high Sharpe ratios and large positive alphas. However, returns to these strategies also display significant time-variation that is not very well understood. I show that expected momentum returns vary negatively and monotonically with the formation period return difference between past winners and losers, which I term the momentum gap. A one standard deviation increase in the momentum gap predicts a 1.29 percent decrease in the monthly momentum return after controlling for existing predictors. The momentum gap remains a significant predictor in out-of-sample tests. Conditional momentum strategies using the momentum gap yield substantially higher Sharpe ratios and lower skewness than the unconditional strategy. These findings are less consistent with the notion that past return proxies for the loading on a priced risk factor. I find evidence to support the alternative hypothesis that momentum is a mispricing phenomenon and that the momentum gap measures momentum arbitrage activity.
Alpha Highlight:
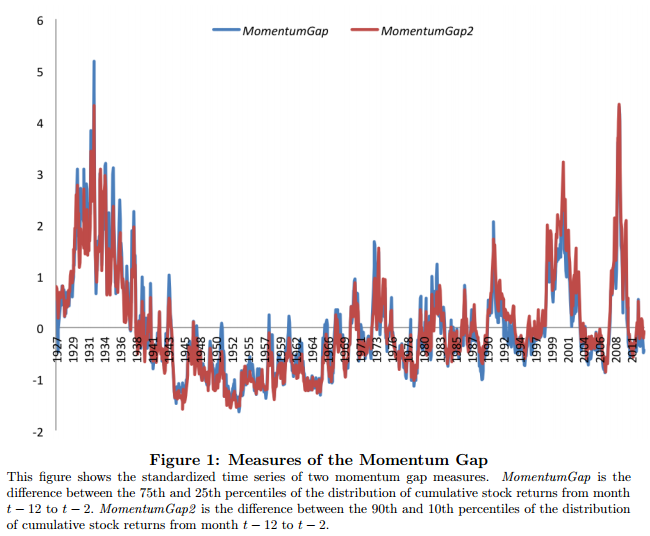
Momentum strategies, which go long past winners and short past losers, have historically outperformed. This paper extends the momentum research and finds that there is a negative relationship between momentum returns and the formation period return difference, or “gap,” between past winners and losers. The term for their enhanced momentum factor is Momentum Gap, defined here:
- Momentum Gap is defined as the difference between 75th and 25th percentiles of the distribution of cumulative stock returns from month t-12 to t-2. (Paper also use 90th and 10th percentiles in their back tests.)
For example, let’s say you looked at stock returns from some year, say, 1991, and sorted them into quartiles based on momentum. You might find that at the 75th percentile, these relatively high momentum stocks returned, say, 12%, while at the 25th percentile, these relatively lower momentum stocks returned, say, 10%. In this case, the momentum “gap” between high/low momentum would be 2%. It turns out this gap changes over time (shows “time variation”).
The figure below plots the Momentum Gap based on the CRSP universe from 1926 to 2012.

The results are hypothetical results and are NOT an indicator of future results and do NOT represent returns that any investor actually attained. Indexes are unmanaged, do not reflect management or trading fees, and one cannot invest directly in an index. Additional information regarding the construction of these results is available upon request.
Key Findings:
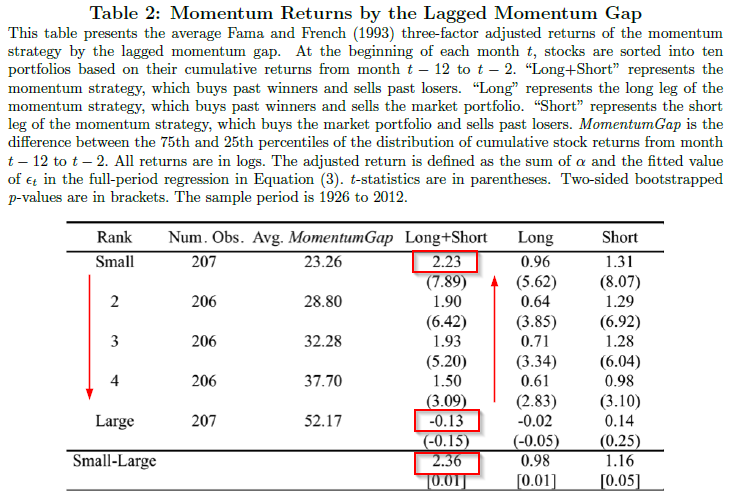
- The Momentum Gap is negatively related to momentum returns. That is, if the lagged momentum gap is small, subsequent long/short momentum returns are high; if the lagged momentum gap is large, subsequent long/short momentum returns are low.
- A one standard deviation increase in Momentum Gap is associated with a 1.29% decrease in the monthly momentum returns. (Details see Table 3). This new predictor is quite significant in out-of-sample tests.
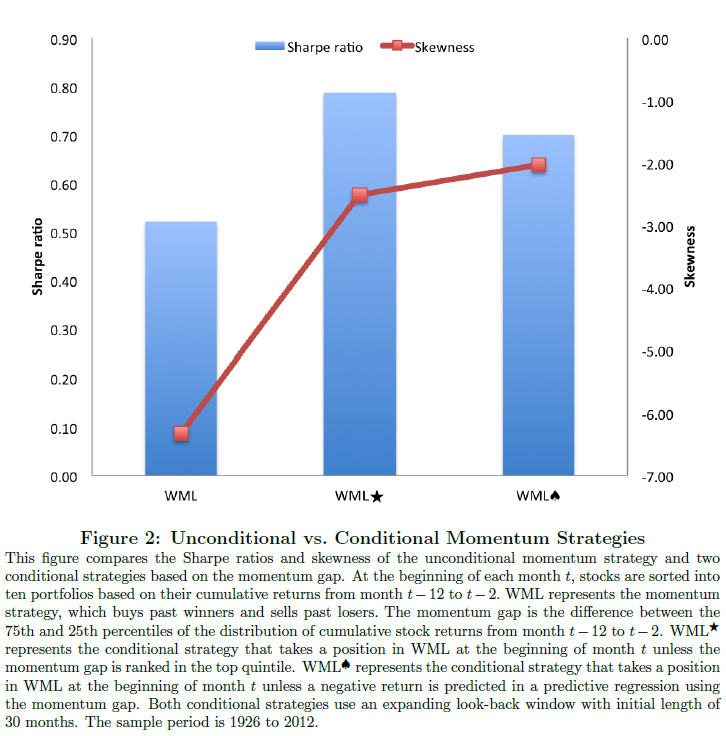
- Conditional Momentum Strategies using the Momentum Gap yield substantially higher Sharpe Ratios and lower skewness than unconditional strategies.
The table below shows the relationship between the gap and subsequent momentum returns; when momentum gap is small (23.26% average gap), momentum earns large alphas of 2.23% per month, while when the momentum gap is large (52.17% average gap), momentum loses 0.13% a month.

The results are hypothetical results and are NOT an indicator of future results and do NOT represent returns that any investor actually attained. Indexes are unmanaged, do not reflect management or trading fees, and one cannot invest directly in an index. Additional information regarding the construction of these results is available upon request.
Since long/short momentum strategies work very well when the Momentum Gap is small, can one use this to time when to be in a momentum long/short strategy? The answer is yes, a conditional momentum strategy yields higher Sharpe ratios with lower skewness, as shown below:

The results are hypothetical results and are NOT an indicator of future results and do NOT represent returns that any investor actually attained. Indexes are unmanaged, do not reflect management or trading fees, and one cannot invest directly in an index. Additional information regarding the construction of these results is available upon request.
The paper proposes 3 hypothesis to explain the Momentum Gap finding:
- Hypothesis 1: The empirical relation is spurious and related to data-mining.
- Hypothesis 2: The Momentum Gap’s predictive power is driven by its relationship to the business cycle.
- Hypothesis 3: The Momentum Gap reflects the degree to which arbitrageurs are trading the strategy, and thus momentum is a mispricing phenomenon.
The paper finds no evidence to support first 2 hypothesis, but does find evidence for hypothesis 3 (mispricing).
Overall, this is an interesting paper with an idea that appears to add value to a momentum strategy, by providing a timing mechanism (Momentum Gap). The only downside to such a strategy, is that one would not always be invested in the momentum long/short strategy (which may be an issue for institutional investors).
About the Author: Wesley Gray, PhD
—
Important Disclosures
For informational and educational purposes only and should not be construed as specific investment, accounting, legal, or tax advice. Certain information is deemed to be reliable, but its accuracy and completeness cannot be guaranteed. Third party information may become outdated or otherwise superseded without notice. Neither the Securities and Exchange Commission (SEC) nor any other federal or state agency has approved, determined the accuracy, or confirmed the adequacy of this article.
The views and opinions expressed herein are those of the author and do not necessarily reflect the views of Alpha Architect, its affiliates or its employees. Our full disclosures are available here. Definitions of common statistics used in our analysis are available here (towards the bottom).
Join thousands of other readers and subscribe to our blog.

