Fads, Martingales, and Market Efficiency
- Lehmann
- A version of the paper can be found here.
- Want a summary of academic papers with alpha? Check out our Academic Research Recap Category.
Abstract:
Predictable variation in equity returns might reflect either (1) predictable changes in expected returns or (2) market inefficiency and stock price “overreaction.” These explanations can be distinguished by examining returns over short time intervals since systematic changes in fundamental valuation over intervals like a week should not occur in efficient markets. The evidence suggests that the “winners” and “losers” one week experience sizable return reversals the next week in a way that reflects apparent arbitrage profits which persist after corrections for bid-ask spreads and plausible transactions costs. This probably reflects inefficiency in the market for liquidity around large changes.
Core Idea:
Lehmann(1990) rejects the efficient markets hypothesis (EMH) by pointing out that stock prices exhibit short-term intervals (weekly horizon).
Lehmann(1990) shows there are short-term arbitrage opportunities using momentum. The main findings are as follows:
- “Winners” and “Losers” experience sizable return reversals the next week.
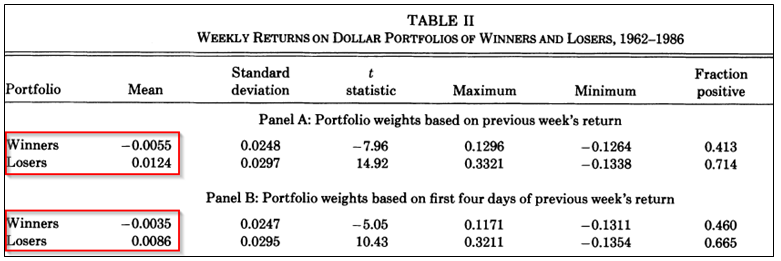
- Table II shows that portfolios of securities that had positive returns (winners) in the prior week typically had negative returns in the next week (-0.35% to -0.55% per week on average), while those with negative returns (losers) in the prior week typically had positive returns in the next week (0.86% to 1.24% per week on average).
- “Contrarian strategies” (buying past losers and selling past winners) generate abnormal returns of over 2% per month.

The results are hypothetical results and are NOT an indicator of future results and do NOT represent returns that any investor actually attained. Indexes are unmanaged, do not reflect management or trading fees, and one cannot invest directly in an index. Additional information regarding the construction of these results is available upon request.
Overall, Lehmann (1990) believes that investors’ cognitive bias lead to market inefficiency and short-term return reversals.
Similar with Lehmann (1990), Jegadeesh (1990) also demonstrates the short-term reversal effect (monthly horizon).
This finding (and Jegadeesh 1990) is why academics generally use 2-12 momentum (last 12-month returns, excluding the previous month) when examining intermediate-term momentum (last 12-month returns) effect on stock prices.
About the Author: Jack Vogel, PhD
—
Important Disclosures
For informational and educational purposes only and should not be construed as specific investment, accounting, legal, or tax advice. Certain information is deemed to be reliable, but its accuracy and completeness cannot be guaranteed. Third party information may become outdated or otherwise superseded without notice. Neither the Securities and Exchange Commission (SEC) nor any other federal or state agency has approved, determined the accuracy, or confirmed the adequacy of this article.
The views and opinions expressed herein are those of the author and do not necessarily reflect the views of Alpha Architect, its affiliates or its employees. Our full disclosures are available here. Definitions of common statistics used in our analysis are available here (towards the bottom).
Join thousands of other readers and subscribe to our blog.

