The Role of Fundamental Analysis in Information Arbitrage: Evidence from Short Seller Recommendations
- Hemang Desai, Srinivasan Krishnamurthy and Kumar Venkataraman
- A version of the paper can be found here.
Abstract:
We examine whether information arbitrageurs attempt to exploit the return predictability in valuation and fundamental signals. Using a unique database of short sale recommendations, we document that firm fundamentals, such as accruals, sales growth, gross-margin and SG&A, and valuation indicators, such as book-to-market ratio and return momentum, contain valuable information correlated with the trading behavior of short sellers. We show that our empirical model explaining short seller recommendations is successful in predicting both short interest and future returns for a broader sample in an out-of-sample period. We present an important application of the model in distinguishing between valuation and arbitrage-motivated short selling. Overall, these findings present additional insights into the decision process of short sellers and validate the importance of fundamental analysis in the information arbitrage process.
Data Sources:
The authors compile a “direct” list of short sale recommendations which includes every short recommendation (an initial sample which consisted of 67 firms) issued by a single independent research firm for its institutional clients. The time period analyzed is from 1998 until June 2005. After some standard screens, the sample ends up being 54 firms.
Discussion:
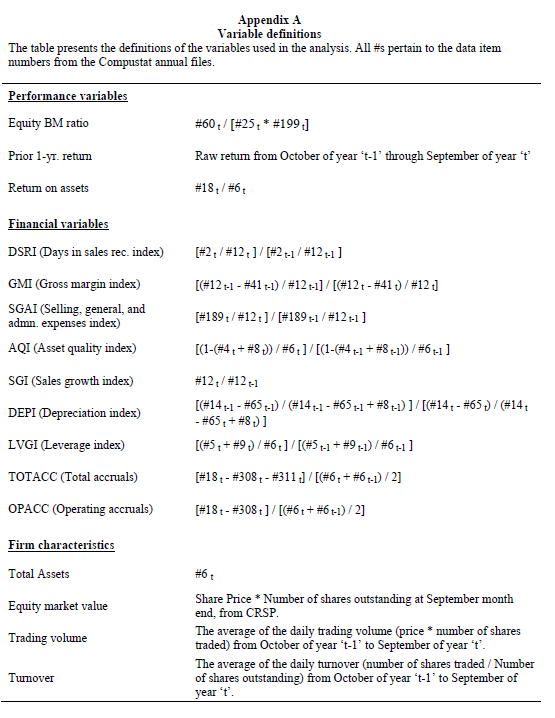
Using an innovative approach to gather data, where no credible database exists, the authors set forth to disentangle noisy causes of short selling (hedging strategies vs information arbitrage strategies) in an attempt to determine if the “smart money” short sellers are actually acting on fundamental valuation information and generating trade profits on this information arbitrage. The authors focus on B/M, accounting accruals (total accruals and operating accruals), book value of total assets, average share turnover, as well as seven financial statement variables related to earnings manipulation (pulled from Beneish (1999)):
- Day’s sales in receivables index (A/R expansion reduces revenue quality)
- Gross margin index (improved margins with high accruals is unsustainable in the long-term)
- Asset quality index (extent of capitalization)
- Sales growth index (high sales growth could indicate inflated revenue)
- Depreciation index (indicates if firm has made income-increasing accounting choices such as increasing useful life of assets, or increasing salvage value)
- Leverage growth index (more leverage and covenants creates an incentive to overstate financial or manipulate performance)
- S,G & A growth index (means higher percentage of spending is needed to generate revenue)
Here are the variables from COMPUSTAT:

The results are hypothetical results and are NOT an indicator of future results and do NOT represent returns that any investor actually attained. Indexes are unmanaged, do not reflect management or trading fees, and one cannot invest directly in an index. Additional information regarding the construction of these results is available upon request.
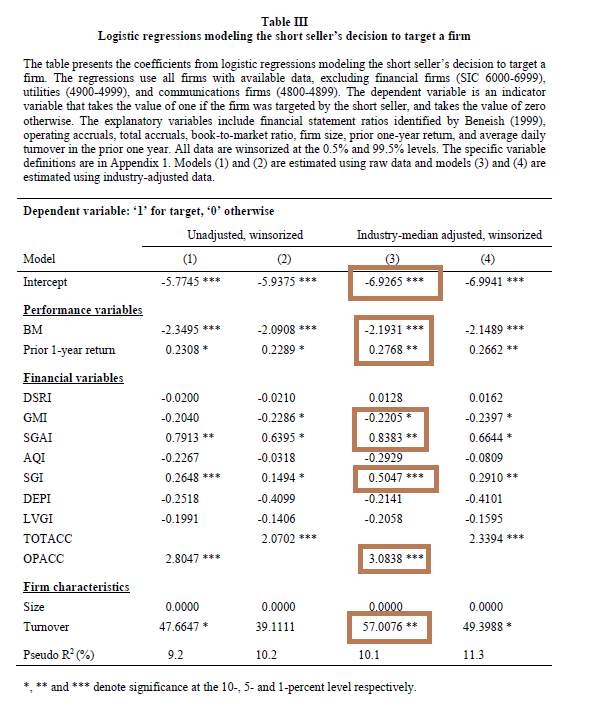
Next, the authors run a logit regression to determine how the laundry list of variables described above are related to the probability of a stock showing up as a short recommendation.

The results are hypothetical results and are NOT an indicator of future results and do NOT represent returns that any investor actually attained. Indexes are unmanaged, do not reflect management or trading fees, and one cannot invest directly in an index. Additional information regarding the construction of these results is available upon request.
The key takeaways as identified by the authors are as follows:
- High operating accruals, sales growth index, and S,G&A index increase the probability a firm will attract short-seller attention.
- short-sellers are attracted to situations where high earnings are unlikely to be backed by high cash flow.
- High price momentum, and low B/M predict short-selling
- short sellers like expensive growth stocks.
- High average turnover
- All else equal, liquid stuff is preferred to illiquid stuff–nobody likes a short squeeze!
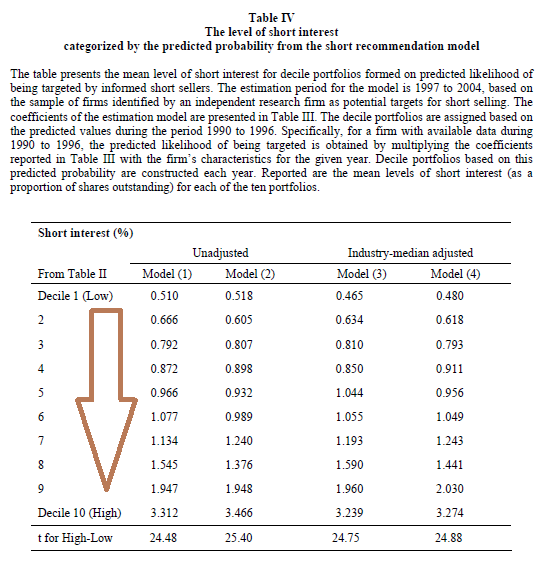
After fitting an equation to past data to identify what factors matter in the short-seller decision process (data-mining essentially), the authors next identify if the model estimated actually predicts short-selling in other periods (an “out of sample” test to address the data-mining concern). The authors sort the population of firms into deciles based on the probability that a firm will become a short recommendation (they look at the 90-96 period, since they used the 97-2004 period to estimate the model).
The model does fairly well. Below is a graph showing how the model predicts future short interest ratios.

The results are hypothetical results and are NOT an indicator of future results and do NOT represent returns that any investor actually attained. Indexes are unmanaged, do not reflect management or trading fees, and one cannot invest directly in an index. Additional information regarding the construction of these results is available upon request.
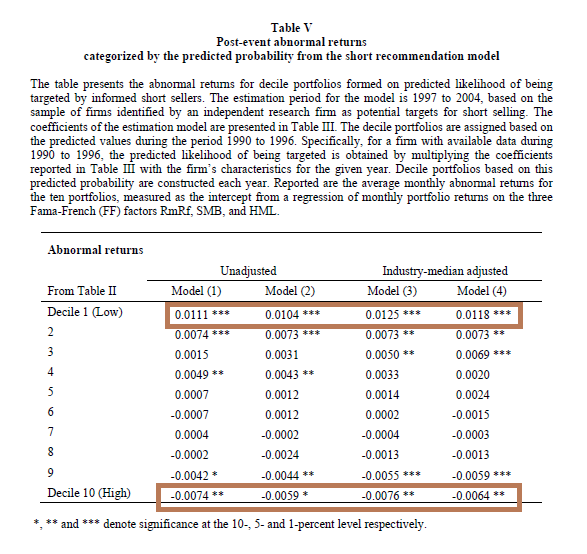
And here is where it gets interesting–a table showing the returns on portfolios that use the predicted short selling model as a way to parse the universe of stocks into ‘good’ and ‘bad.’

The results are hypothetical results and are NOT an indicator of future results and do NOT represent returns that any investor actually attained. Indexes are unmanaged, do not reflect management or trading fees, and one cannot invest directly in an index. Additional information regarding the construction of these results is available upon request.
The monthly abnormal return estimate is 76bps for stocks with a high probability of becoming a short candidate, and the returns are 125bps a month for those firms with a very low probability of becoming a short candidate. The long/short system cranks out 2.01% a month–hallelujah!
Evidence suggests short-sellers do serve a very important role in the market and help unweave the tangle of information components that can often mislead or confuse investors (even the most sophisticated investors), rating agencies, or regulators.
In Michael Lewis’ recent book, The Big Short, he identifies some of the earliest short sellers who identified the MBS house of cards. The investors who were engaged in the short side information discovery process did the market a great service, and legislators should be very wary about killing the messenger just because they don’t like the message.
Investment Strategy:
- Sort the universe of stocks based on the model estimates from Table III
- Short stocks with a high probability of becoming a “short candidate”
- Long stocks with a high probability of NOT becoming a “short candidate”
- Make money.
Commentary:
Overall, this is a nice piece of work that helps us understand how investors make decisions on the short side. None of the baseline results are very surprising–short sellers attack dirtball, overvalued companies–no kidding. However, what is interesting is the 2.01% per month L/S alpha that comes with taking advantage of the “short-selling” prediction model highlighted in the paper.
This paper is likely related to the “short interest ratio” effect we identified a few weeks ago. As Table IV suggests, this strategy indirectly shorts high SIR stocks and longs low SIR stocks–which is the same strategy outlined in “The Good News in Short Interest.”
One downside of this paper is the limited sample size and a single “out-of-sample” test. Before an investor went “all-in” on this strategy it would be prudent to investigate the broad robustness of the strategy by looking at more out-of-sample data points. If anyone out there has some extra time and wants to test the strategy on the 2005-2010 period, please let us know and we’ll post the results on the blog.
About the Author: Wesley Gray, PhD
—
Important Disclosures
For informational and educational purposes only and should not be construed as specific investment, accounting, legal, or tax advice. Certain information is deemed to be reliable, but its accuracy and completeness cannot be guaranteed. Third party information may become outdated or otherwise superseded without notice. Neither the Securities and Exchange Commission (SEC) nor any other federal or state agency has approved, determined the accuracy, or confirmed the adequacy of this article.
The views and opinions expressed herein are those of the author and do not necessarily reflect the views of Alpha Architect, its affiliates or its employees. Our full disclosures are available here. Definitions of common statistics used in our analysis are available here (towards the bottom).
Join thousands of other readers and subscribe to our blog.

