The Good News in Short Interest
- Ekkehart Boehmer & Zsuzsa R. Huszar & Bradford D. Jordan
- The published version of the paper can be found here.
- A more printer friendly, unpublished version of the paper can be found here.
Abstract:
We study the information content in monthly short interest using NYSE-, AMEX-, and NASDAQ-listed stocks from 1988 to 2005. We show that stocks with relatively high short interest subsequently experience negative abnormal returns, but the effect can be transient and of debatable economic significance. In contrast, we find that relatively heavily traded stocks with low short interest experience both statistically and economically significant positive abnormal returns. These positive returns are often larger (in absolute value) than the negative returns observed for heavily shorted stocks. Because stocks with greater short interest are priced more accurately, our results suggest that short selling promotes market efficiency. However, we show that positive information associated with low short interest, which is publicly available, is only slowly incorporated into prices, which raises a broader market efficiency issue. Our results also cast doubt on existing theories of the impact of short sale constraints.
Data Sources:
The data on short interest come from the NYSE, AMEX, and NASDAQ. Other relevant data used in the study come from CRSP. The period tested is 1988-2005. One can gather the data from numerous resources, but a quick google popped up the following provider: http://shortsqueeze.com/.
Discussion:
Short selling is a hot topic that is often highlighted in the mainstream press. Traditional theory has held that short selling constraints prevent negative information from immediately affecting stock prices. And since there is no “long-buying” constraints, positive information is impounded in to prices very quickly. The summary conclusion from the theory is that short selling constraints impede market efficiency. Congratulations, you just bypassed 500 pages of incomprehensible mathematics and figured out what numerous academics papers set out to “prove.”
Market pundits and researchers typically conclude that heavy short interest is a bearish indicator because it signals that many investors anticipate the price to decline . But there are other theories about high short interest: one school of thought suggests that high short interest may simply be an indication for high demand from hedgers or specialized arbitragers trading convertible bonds, options, mergers, or indices, and thus, short-interest says nothing about the valuation of a stock. Another favorite for Wall Street traders is that high short interest is a bullish indicator, because it implies there will be heavy buying demand in the future. Controversy aside, the actual empirical evidence supports the claim that high short interest is predictive of future poor returns, and therefore high short interest is a bearish indicator.
So what’s special about this paper?
Up until this point, everyone has studied heavily shorted stocks and the effects short sale constraints have on the markets. The traditional academic paper has a simple formula: “Yes the markets appear inefficient when one looks at short-interest, but after taking into account trading costs and short-constraints, there are no excess profits on the table.” To make things even more interesting, subsequent research on the topic has concluded that short sale constraints aren’t as binding as previous academic research has previously suggested. So maybe the markets are inefficient AND profits are being left on the table?
While everyone else has been blabbing about high short-interest stocks, this paper is the first to actually look at the performance of low short-interest stocks. In particular, the authors compare the performance between high-short interest stocks and low-short interest stocks. The basic idea is that in the absence of short-selling constraints, stocks that have low short interest are likely undervalued (if short sellers believed these stocks had a value that was equal to or higher than the current market price, short-sellers would pile on with relative ease).
The results are somewhat surprising.
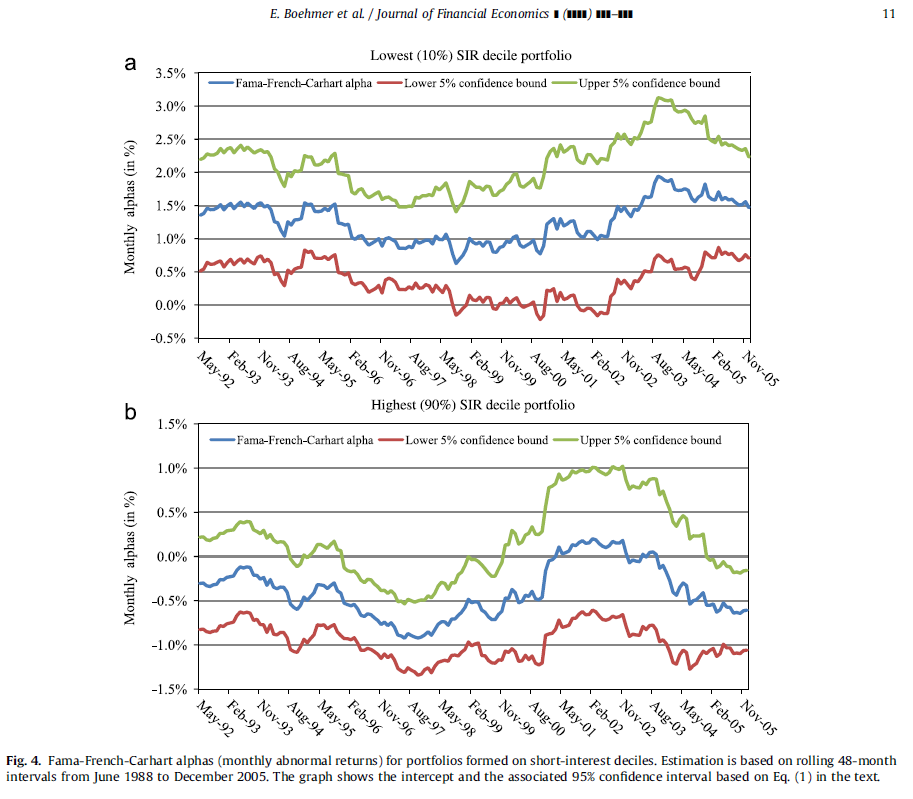
The table below shows the rolling 48-month alpha estimate using the regression equation below:
The alpha estimates represent the average monthly return one would receive after controlling for market risk, size risk, value risk, and momentum risk (if you want to get free access to the factors and stop paying BARRA/MSCI gazillions of dollars of year, click here.)

The results are hypothetical results and are NOT an indicator of future results and do NOT represent returns that any investor actually attained. Indexes are unmanaged, do not reflect management or trading fees, and one cannot invest directly in an index. Additional information regarding the construction of these results is available upon request.
As one can see, the alpha estimates are robust over time and hover around 1% a month for the low short-interest stocks, and around -0.50% a month for the high short-interest stocks. For my fellow caveman out there, what this all means is that you could simply form a basket of lightly shorted stocks, hedge out your market/size/value/momentum risk and you could expect to bank around 1% a month before costs. Or to keep it even easier, simply long a basket of lightly shorted stocks and short a Russell 2000 or SP500 future/ETF.
Unfortunately, to implement the strategy above you’d need a fairly robust and complicated rebalancing strategy. But what if you’re rocking a TD Ameritrade account and don’t have the infrastructure or trading/execution of a full-scale quant shop? Well, you’re F%*&ed and you should simply invest in Vanguard Index Funds.
Just kidding, there is hope!
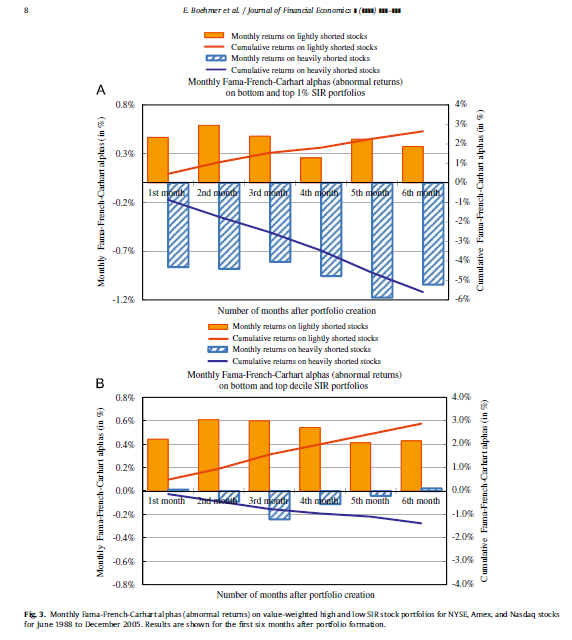
Check out the figure below. The figure gives us a basic understanding of how the low and high short interest portfolios would perform over a 6-month horizon. The nice orange bar graphs highlight the fact that an investor could set the low short interest strategy in place, let it ride for up to 6 months, and not suffer any dramatic “alpha” reduction. This result is a welcome relief, because trying to rebalance this strategy weekly, monthly, or even bi-monthly may get unwieldy for most investors–even professionals.

The results are hypothetical results and are NOT an indicator of future results and do NOT represent returns that any investor actually attained. Indexes are unmanaged, do not reflect management or trading fees, and one cannot invest directly in an index. Additional information regarding the construction of these results is available upon request.
Finally, if you’re a numbers guy like me, here are the raw statistical figures outlining the strategy’s performance over the ’88-’05 time period. Notice the raw return on the long only portfolio is 2% a month, and has an alpha of 1.3% a month–nice! The L/S strategy posts a 1.5% a month raw return and 1.6% alpha a month–even nicer!!!
Investment Strategy:
- Each month, rank all stocks based on short interest ratio and assign each a percentile rank.
- Buy stocks in the lowest percentile.
- Short stocks in the highest percentile.
- Rebalance monthly.
Commentary:
What can I say, I like this strategy. The results are robust, the concept is simple, and the potential for profits are intriguing. There are a lot of ways one can “juice” the returns on this strategy, but that discussion we’ll set aside is for another time and another place. Until then, good luck finding the good news in short interest.
About the Author: Wesley Gray, PhD
—
Important Disclosures
For informational and educational purposes only and should not be construed as specific investment, accounting, legal, or tax advice. Certain information is deemed to be reliable, but its accuracy and completeness cannot be guaranteed. Third party information may become outdated or otherwise superseded without notice. Neither the Securities and Exchange Commission (SEC) nor any other federal or state agency has approved, determined the accuracy, or confirmed the adequacy of this article.
The views and opinions expressed herein are those of the author and do not necessarily reflect the views of Alpha Architect, its affiliates or its employees. Our full disclosures are available here. Definitions of common statistics used in our analysis are available here (towards the bottom).
Join thousands of other readers and subscribe to our blog.

