Tweets and Trades: The Information Content of Stock Microblogs
- Timm Sprenger and Isabell Welpe
- A version of the paper can be found here.
Abstract:
Microblogging forums have become a vibrant online platform to exchange trading ideas and other stock-related information. Using methods from computational linguistics, we analyze roughly 250,000 stock-related microblogging messages, so-called tweets, on a daily basis. We find the sentiment (i.e., bullishness) of tweets to be associated with abnormal stock returns and message volume to predict next-day trading volume. In addition, we analyze the mechanism leading to efficient aggregation of information in microblogging forums. Our results demonstrate that users providing above average investment advice are retweeted (i.e., quoted) more often and have more followers, which amplifies their share of voice in microblogging forums.
Data Sources:
The authors examine “dollar-tagged symbol ticker” messages from Twitter during a 6-month period from January 1st to June 30th, 2010. Dollar-tagged symbols are the standard way in which traders communicate via tweets–for example, a user posting a message on Apple would start the tweet with “$AAPL.” In total, the authors collect 249,533 tweets on companies in the S&P 100. Financial return data comes from Thomson Reuters Data stream (which stinks in my opinion, but we’ll roll with it.)
Discussion:
Twitter trading strategies have recently captured the imagination of investors–see the following article as an example. The hype doesn’t merely make good TV, but has also lead to frenzied capital allocation attempts. Recently, Derwent Capital Markets raised over $100mm under the guise that they will somehow make money following ‘tweets.’
So what’s all the hype over Twitter?
Well, the craze all started with the article, “Twitter Mood Predicts the Stock Market.”
The authors utilize OpinionFinder software and GPOMS to facilitate the identification of moods in millions of tweets. I guess the idea is that when people are happy/calm/alert/sure/vital/kind it translates into predictable market behavior in the future. Below is a figure taken from the paper that shows how the authors took a bunch of whiz-bang statistical techniques and determined that certain moods can predict the direction of the DJIA 87% of the time.
Figure 1 immediately caused me to launch a bullsh&% cluster–nothing that complicated is likely to robustly predict the market.
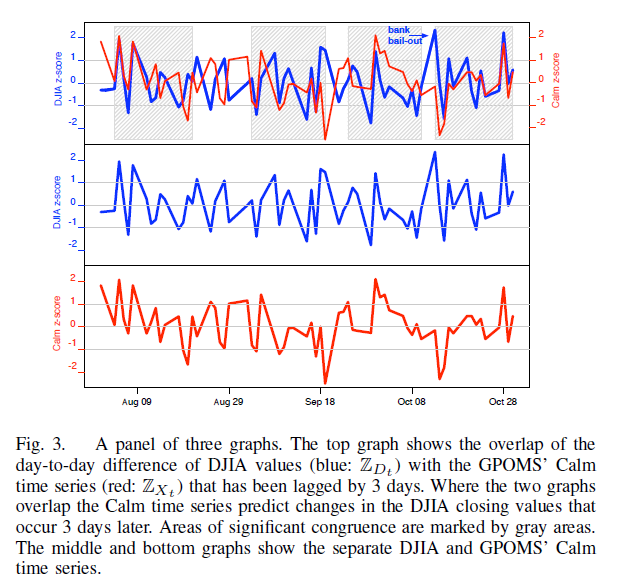
Despite my lack of conviction, the authors present the following figure and suggest that the GPOMS calm mood indicator is predictive of the day-to-day difference in DJIA values.
The results are hypothetical results and are NOT an indicator of future results and do NOT represent returns that any investor actually attained. Indexes are unmanaged, do not reflect management or trading fees, and one cannot invest directly in an index. Additional information regarding the construction of these results is available upon request.
I’m not a rocket surgeon or a brain scientist, but the first graph looks a lot like two random time series. Sure there are a few instances where the DJIA difference and the lagged ‘calm’ mood indicator overlap, but seriously, in the face of fancy math and statistical techniques, I’m not sure I’d put real money on that figure. In the end, the analysis is showing that when people are calm, this somehow predicts where the DJIA is going to move in the next few days?
Does that make any sense at all?
In my mind, this sort of analysis is akin to my uncle’s stock trading rule of thumb: If the Dallas Cowboys win the Thanksgiving Day football game the market will be on a tear; if they lose the game, the market will suck wind the next year. He swears by it.
Anyway, my main takeaway is that using mood to predict stock prices doesn’t pass the sniff test, and yet, the financial blogosphere went crazy when this paper was released and a couple of folks raised a $100mm for a hedge fund. Amazing.
So why is this research paper different?
Despite a rather lackluster beginning, the research into tweets and market performance has gotten better. Tweets and Trades takes the analysis of twitter one step further and analyzes on a stock-by-stock basis how sentiment affects stock returns.
Intuitively, it doesn’t make sense that a bunch a folks posting tweets would have any affect on stock returns. Who would make a trade based on a tweet? Isn’t that grounds for getting fired on the spot?
Nonetheless, if one thinks a bit deeper about the question, it might be plausible that valid rumors, market sentiment, and qualitative insight can be gleamed from the messages of thousands of users focused on an individual name. Perhaps the wisdom of crowds effect is captured by Twitter?
The paper goes in to a lot of detail explaining the structure of tweets and how user interact with one another–for motivated readers I recommend you read the 89-page source doc. However, for our blog readers, I’m going to post the most interesting material and how it may help improve your investment process.
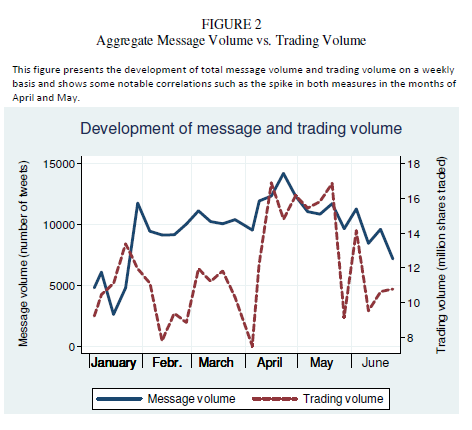
Finding 1: Total message volume and trading volume are related (.47 correlation).
The results are hypothetical results and are NOT an indicator of future results and do NOT represent returns that any investor actually attained. Indexes are unmanaged, do not reflect management or trading fees, and one cannot invest directly in an index. Additional information regarding the construction of these results is available upon request.
Finding 2: Tweet sentiment on an individual stock is related to individual stock returns (.17 correlation). Nothing epic, but does point out that tweets may not be pure noise.
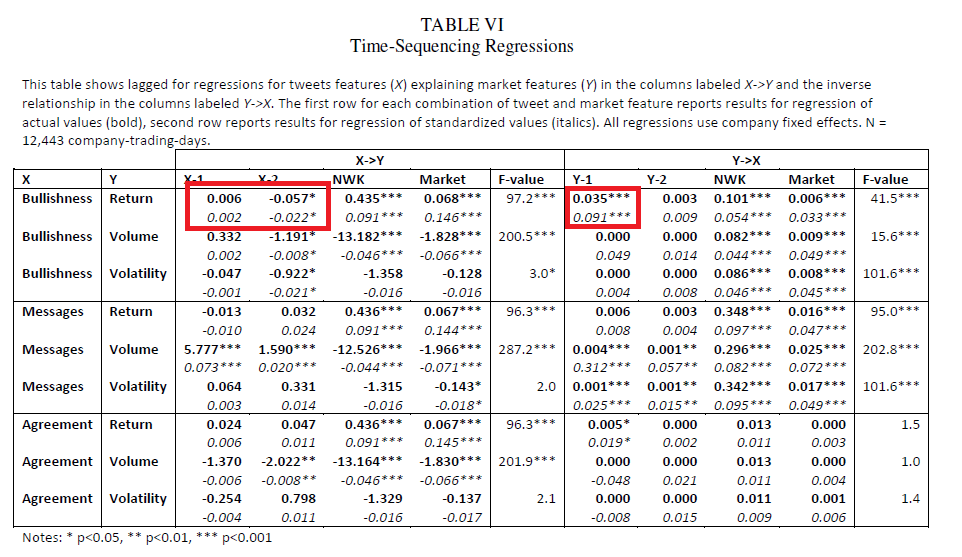
Finding 3: Overall bullish sentiment, after controlling for general market movements, isn’t related to next day returns (see .006 estimate under X-1), but bullishness is related to returns 2 days from now (see -.057 estimate under X-2), and the bullishness actually predicts negative returns! Also, positive returns actually predict bullishness, i.e., tweeters as a group are market lemmings, not market leaders (see .035 estimate under Y-1).
The results are hypothetical results and are NOT an indicator of future results and do NOT represent returns that any investor actually attained. Indexes are unmanaged, do not reflect management or trading fees, and one cannot invest directly in an index. Additional information regarding the construction of these results is available upon request.
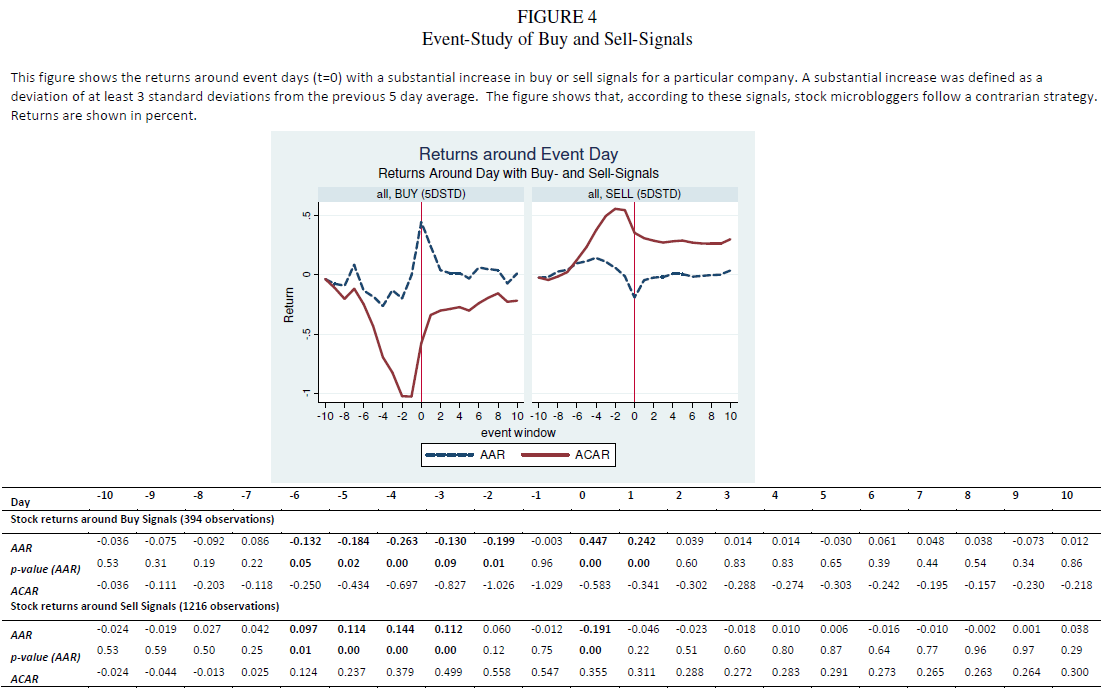
Finding 4: Strong Buy and sell signals (as measured by 2+ standard deviations away from 5-day average) on individual stocks actually work. Strong buy signals typically follow a streak of poor performance, lead to a quick rebound, and earn around 24bp in abnormal return the day following the tweet. Strong sell recommendations show a similar pattern: follow a hot streak, lead to a quick sell-off, and earn around 5bp in abnormal return following the tweet (note: the 5bp are statistically insignificant and would obviously be overwhelmed by trading costs).
The results are hypothetical results and are NOT an indicator of future results and do NOT represent returns that any investor actually attained. Indexes are unmanaged, do not reflect management or trading fees, and one cannot invest directly in an index. Additional information regarding the construction of these results is available upon request.
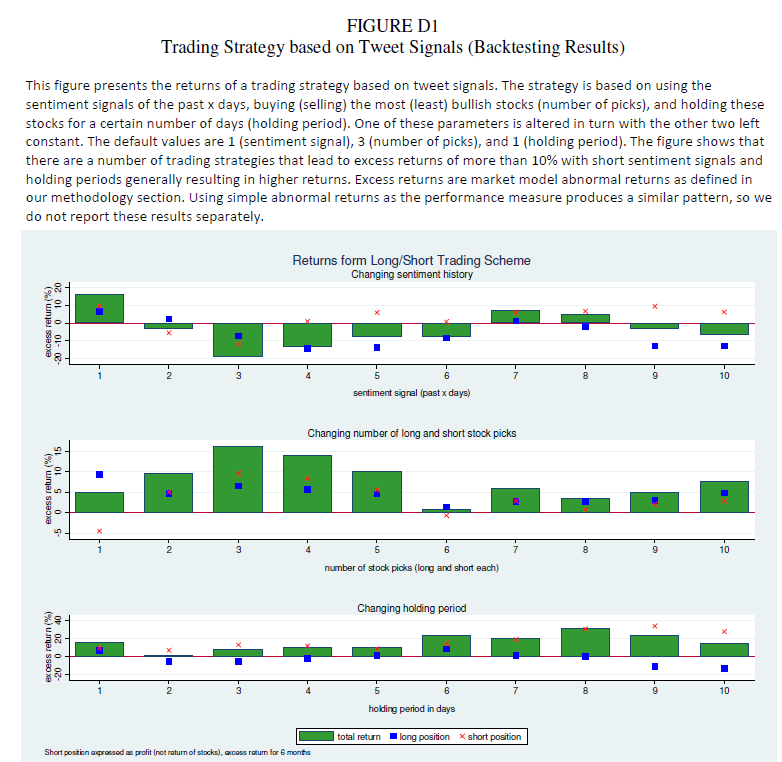
Finding 5: Trading long/short portfolios based on tweet signals can be highly profitable!
The results are hypothetical results and are NOT an indicator of future results and do NOT represent returns that any investor actually attained. Indexes are unmanaged, do not reflect management or trading fees, and one cannot invest directly in an index. Additional information regarding the construction of these results is available upon request.
Over a 6-month period, trading the 1) top/bottom 3 stocks, 2) on recent sentiment signal (previous day signal), and 3)holding for 1 day, appears to be profitable–greater than 15% in some cases!
- The chart also shows us that any signal from tweets are short-lived–L/S strategies that use sentiment indicators from over 1-day old are worthless.
- Increasing the number of stocks, decrease the trading strategy return (i.e., holding top/bottom 3 is better than holding the top/bottom 6).
- Holding period seems to have a positive effect, at the margin: longer holding periods increase returns, on average.
Investment Strategy:
- Create a model that identifies bullish/bearish sentiment from tweets (or head to http://tweettrader.net/).
- Long stocks with high bullishness, short stocks with low bullishness.
- Make money.
Commentary:
My biggest beef with this strategy is the expected transaction costs and the challenge of building a model that can effectively categorize bullish/bearish sentiment. Because of this concern, I wouldn’t recommend this strategy to investors who pay over 30mils a share to trade stocks–which pretty much knocks out all of us who aren’t daytrader types. However, for active traders, who have lean and mean commission schedules and the infrastructure to trade hyper-actively, this might be an interesting avenue to explore.
It only seems fitting that I recommend you “tweet” this blog post with your friends–perhaps we’ll create some ‘bullish’ sentiment for our blog :-)
About the Author: Wesley Gray, PhD
—
Important Disclosures
For informational and educational purposes only and should not be construed as specific investment, accounting, legal, or tax advice. Certain information is deemed to be reliable, but its accuracy and completeness cannot be guaranteed. Third party information may become outdated or otherwise superseded without notice. Neither the Securities and Exchange Commission (SEC) nor any other federal or state agency has approved, determined the accuracy, or confirmed the adequacy of this article.
The views and opinions expressed herein are those of the author and do not necessarily reflect the views of Alpha Architect, its affiliates or its employees. Our full disclosures are available here. Definitions of common statistics used in our analysis are available here (towards the bottom).
Join thousands of other readers and subscribe to our blog.


