Introduction to Finance: Class 4
Stock Valuation
What is stock valuation?
There are many ways to determine the value or worth of a stock (refamiliarize yourself with what a stock is).
Each stock is different, and each industry sector has unique properties that may require varying valuation approaches…Stock is sometimes referred to as shares, securities or equity.
· · · · ·
Key Concepts:
- What is Common Stock?
- Common Stock Valuation
- Dividends
- Required Returns
- Current Value of a Stock
What is Common Stock?
- A share of stock represents an ownership stake in the firm
- More reading here
- An investor who buys a share of stock has two basic rights:
- Control Rights
- Voting right: elect representatives (directors) who hire management to run the firm
- Cash Flow Rights
- Right to share proportionally in dividends paid
- Dividends are discretionary payments by corporation to shareholders in the form of cash or stock
- Equity Financing
- Differences between Debt & Equity Financing (REVIEW)
- Debt
- Not an ownership interest
- Creditors do not have voting rights
- Interest is considered a cost of doing business and is tax deductible
- Creditors have legal recourse if interest or principal payments are missed
- Excess debt can lead to financial distress and bankruptcy
- Equity
- Ownership interest
- Common stockholders vote for the board of directors and other issues
- Dividends are not considered a cost of doing business and are not tax deductible
- Dividends are not a liability of the firm, and stockholders have no legal recourse if dividends are not paid
- An all equity firm can not go bankrupt merely due to debt since it has no debt
- Debt
- Differences between Debt & Equity Financing (REVIEW)
Common Stock Valuation
- More difficult than bond valuation since:
- Cash flows are not known
- Stocks have an infinite life
- Don’t know what rate of return market requires
- If you buy share of stock, you receive cash in two ways
- The company pays dividends
- You sell your shares either to another investor in the market or back to the company
- As with bonds, the price of the stock is the present value of these expected cash flows
One-Period Example
- Suppose you are thinking of purchasing the stock of Moore Oil, Inc. You expect it to pay a $2 dividend in one year, and you believe that you can sell the stock for $14 at that time. If you require a return of 20% on investments of this risk, what is the maximum you would be willing to pay?
- Compute the PV of the expected cash flows
- Price = (14 + 2) / (1.2) = $13.33
Two-Period Example
- Now, what if you decide to hold the stock for two years? In addition to the $2 dividend in one year, you expect a dividend of $2.10 and a stock price of $14.70 both at the end of year 2. Now how much would you be willing to pay?
- PV = 2 / (1.2) + (2.10 + 14.70) / (1.2)^2 = 13.33
Three-Period Example
- Finally, what if you decide to hold the stock for three periods? In addition to the dividends at the end of years 1 and 2, you expect to receive a dividend of $2.205 and a stock price of $15.435 both at the end of year 3. Now how much would you be willing to pay?
- PV = 2 / 1.2 + 2.10 / (1.2)^2 + (2.205 + 15.435) / (1.2)^3 = 13.33
Developing the Stock Valuation Model
- You could continue to push back when you sell the stock
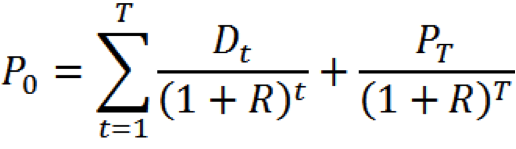
- You would find that the price of the stock is really just the present value:

- So, how can we estimate all future dividend payments?
Dividends
Estimating Dividends: Special Cases
- Constant dividend (zero growth)
- The firm will pay a constant dividend forever
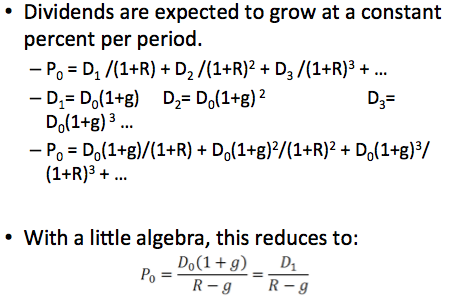
- Constant dividend growth
- The firm will increase the dividend by a constant percent every period
- Supernormal growth
- Dividend growth is not consistent initially, but settles down to constant growth eventually
Constant Dividend
- If dividends are expected to be constant (Dt=D) at regular intervals forever, then value stock as a perpetuity
- P0 = D / R
- Suppose stock is expected to pay a $0.50 dividend every quarter and the required return is 10% with quarterly compounding. What is the price?
- Quarterly required return = 10% / 4 = 2.5%
- P0 = .50 / .025 = $20
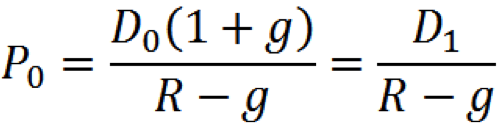
Constant Dividend Growth Model
Dividend Growth Model: Example
- Suppose Joe’s Place, Inc. just paid a dividend of $.50. It is expected to increase its dividend by 2% per year. If the market requires a return of 15% on assets of this risk, how much should the stock be selling for?
- P0 = D1 / (R – g)
- D1 = D0 x (1+g)
- D1 = 0.50 x (1+ 0.02) = 0.51
- P0 = 0.51 / (.15 – .02)
- P0= $3.92
Dividend Growth Model Assumptions
- Stock grows at constant rate (g constant)
- Product market the firm operates in “settles down” to a steady state
- Firms manage dividend policy to foster constant growth
- Required return exceeds growth rate (R > g)
- Geometric series assumes “r” < 1 (or (1+g)/(1+R) < 1)
- In long run, relation must hold
- In short run, R may be less than g (supernormal growth problem)
Nonconstant Dividend Growth
- In short run, supernormal growth rate may exceed required return (g > R)
- In long run, dividend policy reverts to:
- No future dividends
- All future dividends are constant
- All future dividends grow at a constant rate
Nonconstant Dividend Growth: Example
- Suppose a firm expects to increase dividends by 20% in one year and by 15% in two years. After that, dividends will increase at a rate of 5% per year indefinitely. If last year’s dividend was $1 and the required return is 20%, what is the price of the stock?
- Compute the dividends until growth levels off
- D1 = 1(1.2) = $1.20
- D2 = 1.20(1.15) = $1.38
- D3 = 1.38(1.05) = $1.449
- Compute the dividends until growth levels off
- Find the expected future price of dividends starting in Year 3
- P2 = D3 / (R – g) = $1.449 / (.2 – .05) = $9.66
- Find the present value of the expected future cash flows
- P0 = $1.20 / (1.2) + ($1.38 + 9.66) / (1.2)2 = $8.67
Stocks that Don’t Pay Dividends
- Many firms do not pay dividends: Apple, Google, Amazon
- Are the shares of these firms worthless?
- No – instead of paying dividends, they plowback cash flow into internal projects
- For a stock that currently pays no dividend, market value derives from
- Hope of future dividends, and/or
- Expectation of a liquidating dividend
- Our valuation models only say that dividends cannot be zero in all periods
Required Returns
- Dividend growth model sheds light on required return
- Rearrange and solve for R
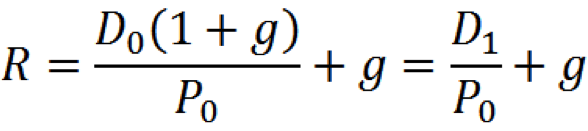
- Total return has two parts
- Dividend yield (D1/P0) – return from dividend next period
- Capital gain yield (g) – rate at which value of investment grows
Required Return: Example
- A firm’s stock is selling for $10.50. It just paid a $1 dividend and dividends are expected to grow at 5% per year.
- What is the required return?
- R = D1/P0 + g
- R = [$1 x (1.05)/$10.50] + .05 = 15%
- What is the dividend yield?
- Dividend yield = D1/P0
- Dividend yield = $1.05 / $10.50 = 10%
- What is the capital gains yield?
- Capital gain yield = g = 5%
Other methods to consider…. here.
Current Value of a Stock
- We covered special cases that allow us to value stocks
- As with bonds, numerous factors influence price of stock
- Large fluctuations in value of stocks (even over short periods)
- Current value of stock determined by the market
- Constantly changing as new information arrives and investors reassess firm’s future cash flows and risks
- Easiest way to find current value is the Internet
Wrap-Up
- Stock represents ownership stake in the firm
- Stock price is the present value of all expected future dividends
- Required return is sum of dividend yield and capital gain

For more classes:
Education Series

About the Author: Victoria Tran
—
Important Disclosures
For informational and educational purposes only and should not be construed as specific investment, accounting, legal, or tax advice. Certain information is deemed to be reliable, but its accuracy and completeness cannot be guaranteed. Third party information may become outdated or otherwise superseded without notice. Neither the Securities and Exchange Commission (SEC) nor any other federal or state agency has approved, determined the accuracy, or confirmed the adequacy of this article.
The views and opinions expressed herein are those of the author and do not necessarily reflect the views of Alpha Architect, its affiliates or its employees. Our full disclosures are available here. Definitions of common statistics used in our analysis are available here (towards the bottom).
Join thousands of other readers and subscribe to our blog.