Introduction to Finance: Class 7
Lessons from Capital Market History
What is a capital market?
Capital markets channel savings and investment between suppliers of capital such as retail investors and institutional investors, and users of capital like businesses, government and individuals. Capital markets are vital to the functioning of an economy, since capital is a critical component for generating economic output. Capital markets include primary markets, where new stock and bond issues are sold to investors, and secondary markets, which trade existing securities. —Source
Capital Market Video
· · · · · Key Concepts:
- Importance of Financial Markets
- Return on Investments
- Historical Returns on Investments
- Risks of Investments
- Historical Risks of Investments
Importance of Financial Markets
- Financial markets allow companies, governments, and individuals to increase their utility
- Savers have the ability to invest in financial assets so they can defer consumption and earn a return to compensate them for doing so
- Borrowers have better access to the capital that is available, allowing them to invest in productive assets
- Financial markets also provide us with information about the returns that are required for various levels of risk
- We can examine returns in the financial markets to help us determine the appropriate returns on non-financial assets
- Lessons from capital market history:
- There is a reward for bearing risk
- The greater the risk, the greater the potential reward
- This is called the risk-return trade-off
Return on Investments
Dollar Returns
- Total dollar return = income from investment + capital gain (loss) due to change in price
- Example:
- You bought a bond for $950 one year ago. You have received two coupons of $30 each. You can sell the bond for $975 today.
- What is your total dollar return?
- Income = $30 + $30 = $60
- Capital gain = $975 – $950 = $25
- Total dollar return = $60 + $25 = $85
Percentage Returns
- It is generally more intuitive to think in terms of percentages than dollar returns
- Dividend yield = income / beginning price
- Capital gains yield = (ending price – beginning price) / beginning price
- Total percentage return = dividend yield + capital gains yield
Example: Calculating Returns
- You bought a stock for $35 and you received a dividend of $1.25. The stock is now selling for $40.
- What is your dollar return?
- Dollar return = 1.25 + (40 – 35) = $6.25
- What is your percentage return?
- Dividend yield = 1.25 / 35 = 3.57%
- Capital gains yield = (40 – 35) / 35 = 14.29%
- Total percentage return = 3.57 + 14.29 = 17.86%
- Total percentage return = ($6.25 / 35) = 17.86%
- What is your dollar return?
Mean (Average) Returns
- The mean (arithmetic average) return is a measure of the “center” of a distribution of returns.
- The mean allows you to summarize a series of returns into one number
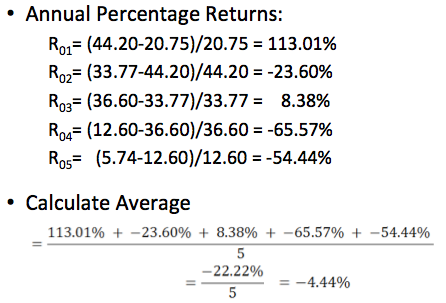
- Calculating average returns:


Example:
- Krispy Kreme had year-end stock prices of:
- $20.75 (2000)
- $44.20 (2001)
- $33.77 (2002)
- $36.60 (2003)
- $12.60 (2004)
- $5.74 (2005)
- What was the mean percentage return of Krispy Kreme from 2001-2005 (ignoring any dividends)?
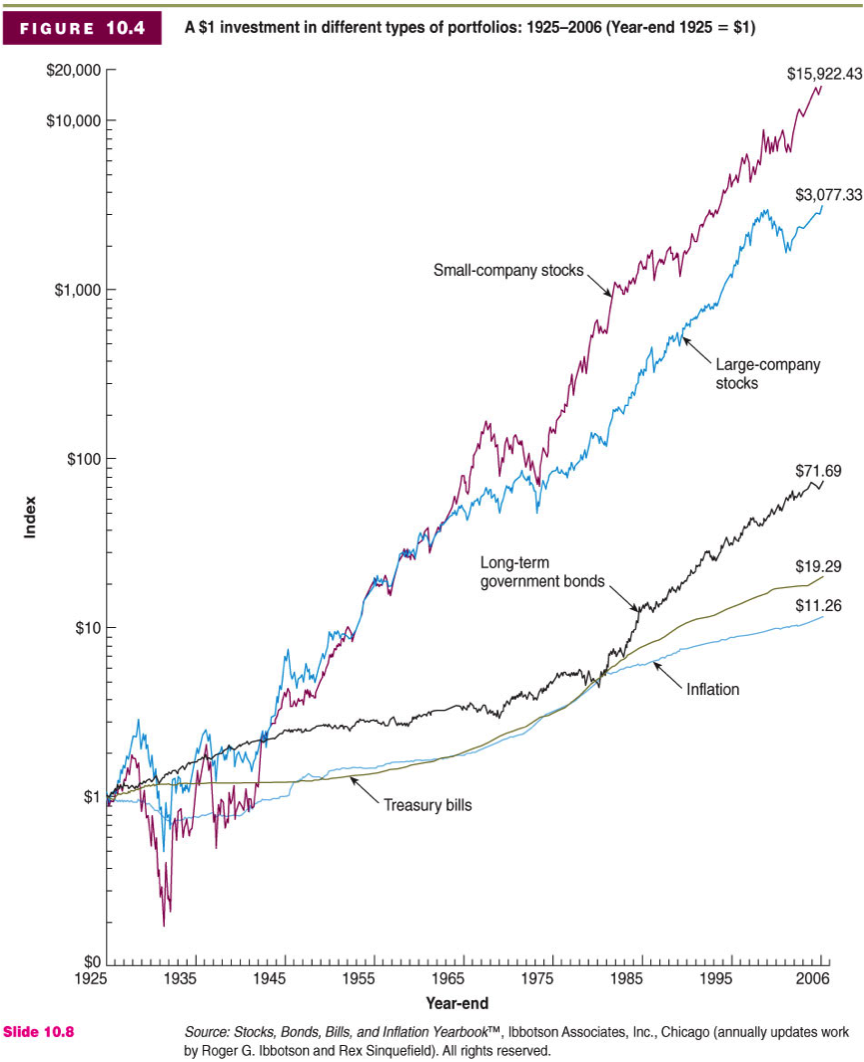
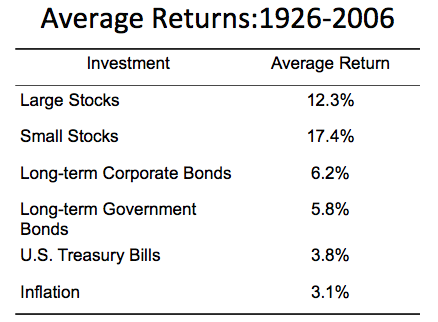
Historical Returns on Investments
Risks of Investments
What is a risk?
- In finance we define risk as the chance that something other than what is expected occurs → variability of returns
- An investment is risky if more than one future outcome is possible—that is, there are two or more possible payoffs associated with the investment
- A probability distribution summarizes each possible outcome along with the chance, or probability, that outcome will occur
- One estimate of the riskiness of an investment is the variance of the returns
Variance & Standard Deviation
- We use variance (and standard deviation) to measure the volatility of asset returns
- Variance:


- Standard deviation:


Example: 
- Variance = Sum of Square Deviations / (# of Observations – 1)
- Variance = 2.056 / (5 – 1)
- Variance = 0.514
- Standard Deviation = Square Root of Variance
- Standard Deviation = √0.514 = 0.514^(1/2)
- Standard Deviation = 0.717
- Standard Deviation = 71.7%
Probability Distributions
- Probability distributions graphically represent the expected return and the variability of the return

- Normal Distribution

Arithmetic vs. Geometric Mean
- Arithmetic average – return earned in an average period over multiple periods
- Geometric average – average compound return per period over multiple periods
![]()
- Which is better?
- The arithmetic average is overly optimistic for long horizons
- The geometric average is overly pessimistic for short horizons
- So the answer depends on the planning period under consideration (some rules of thumb below)
- 15 – 20 years or less: use arithmetic
- 20 – 40 years or so: split the difference between them
- 40 + years: use the geometric
Example:
- What are the arithmetic and geometric averages for the following returns?
- Year 1: 5%
- Year 2: -3%
- Year 3: 12%
- Arithmetic average = (5 + (–3) + 12)/3
- Arithmetic average = 4.67%
- Geometric average = [(1+.05) x (1-.03) x (1+.12)]^(1/3) – 1
- Geometric average = .0449 = 4.49%
Risk Premiums
- The “extra” return earned for taking on risk
- Treasury bills are considered to be risk-free
- The risk premium is the return over and above the risk-free rate
- RP = r – rRF
Historical Risks of Investments
- U.S. Treasury Bills: 3.8 – 3.8 = 0 (by definition!)
- Large Stocks: 12.3 – 3.8 = 8.5%
- Small Stocks: 17.4 – 3.8 = 13.6%
- Long-term Corporate Bonds: 6.2 – 3.8 = 2.4%
- Long-term Government Bonds: 5.8 – 3.8 = 2.0%
· · · · ·
Test Your Knowledge (answers found below)- Your stock investments return 8%, 12%, and -4% in consecutive years. What are the arithmetic and geometric mean returns?
- What is the standard deviation of the above returns?
- Using the standard deviation and mean that you just calculated, and assuming a normal probability distribution, what is the probability of losing 3% or more?
Wrap-Up
- Financial market returns help us determine the appropriate returns on non-financial assets
- Risky investments earn a risk premium
- The greater the potential reward, the greater is the risk
· · · · ·
Solutions
- Stock investments return: 8%, 12%, and -4%. What are the arithmetic and geometric mean returns?
- Arithmetic = (8% + 12% – 4%) / 3
- Arithmetic = 5.33%
- Geometric = (1.08 x 1.12 x 0.96)^(1/3) – 1
- Geometric = 5.11%
- What is the standard deviation of the above returns?
- Variance = [(8-5.33)^2 + (12-5.33)^2 + (-4-5.33)^2] / (3–1)
- Variance = 69.35
- Standard deviation = (69.35)^(1/2)
- Standard deviation = 8.33%
- Using the standard deviation and mean that you just calculated, and assuming a normal probability distribution, what is the probability of losing 3% or more?
- A 3% loss (return of -3%) lies one standard deviation below the mean.
- -3% = 5.33% – (1 x 8.33%)
- There is 16% of the probability falling below that point
- 68% falls between -3% and 13.66% (+/- 1σ)
- So 16% lies below -3% and 16% lies above 13.66%
For more classes:
Education Series

About the Author: Victoria Tran
—
Important Disclosures
For informational and educational purposes only and should not be construed as specific investment, accounting, legal, or tax advice. Certain information is deemed to be reliable, but its accuracy and completeness cannot be guaranteed. Third party information may become outdated or otherwise superseded without notice. Neither the Securities and Exchange Commission (SEC) nor any other federal or state agency has approved, determined the accuracy, or confirmed the adequacy of this article.
The views and opinions expressed herein are those of the author and do not necessarily reflect the views of Alpha Architect, its affiliates or its employees. Our full disclosures are available here. Definitions of common statistics used in our analysis are available here (towards the bottom).
Join thousands of other readers and subscribe to our blog.