At this point, even hard core efficient market fans will likely admit that behavior can influence investment decisions. Humans aren’t robots. However, just because some investors exhibit bad behavior that doesn’t mean they can influence prices. As the story goes, smart investors are prepared to take advantage of profitable opportunities at a moment’s notice, and thus, prices are always roughly efficient (see the sustainable active framework for details).
But can behavior influence asset prices?
University of Chicago professors Sam Hartzmark and Kelly Shue make a strong case that human behavior is influenced by a unique case of framing bias. The authors focus on the “contrast effect,” which is a framing bias that warps how we perceive new information based on our exposure to prior stimulus. Stepping out of finance, Doug Kenrick and Sara Guierres conducted an interesting experiment in 1980, that explores how contrast effects influence perceptions of beauty. Perhaps not surprisingly, when college men were shown a TV clip with 3 extremely attractive women and then asked to rate a photo of an “average” female, their rankings of the average females beauty was much lower than the rankings attributed to the photo by a control group (i.e., they didn’t see the TV clip of the beauty queens).
But contrast effects are readily available in a financial context. For example, say you just lost $10,000 in the stock market. We can either perceive this loss as a huge victory or a huge defeat, depending on our prior experience. Consider two scenarios:
- We run into our stock picking friend who just lost $100,000
- We run into our stock picking friend who just made $100,000
A $10,000 loss is a $10,000 loss. But in scenario #1 we may consider our $10,000 a “victory,” and in scenario #2 we may consider our $10,000 loss a “total devastation.”
Professors Hartzmark and Shue investigate how contrast bias might affect financial markets. The authors look at earnings surprises as a laboratory to test their hypothesis. Their primary hypothesis is that investors will perceive today’s earnings news differently, depending on the realization of yesterday’s earnings news. For example, if yesterday’s earnings news was surprisingly bad, a good earnings news announcement today will be very impressive. Similarly, if yesterday’s earnings news was great, good news today may not be that exciting. The trick in testing this hypothesis is controlling for the fact that prior earnings news releases might convey information about futures news releases. The authors are successful in tackling this empirical problem and identify a surprisingly robust effect: investors are influenced by behavioral bias and this bias is reflected in stock prices.
Do Contrast Effects Influence Market Prices? The Core Result
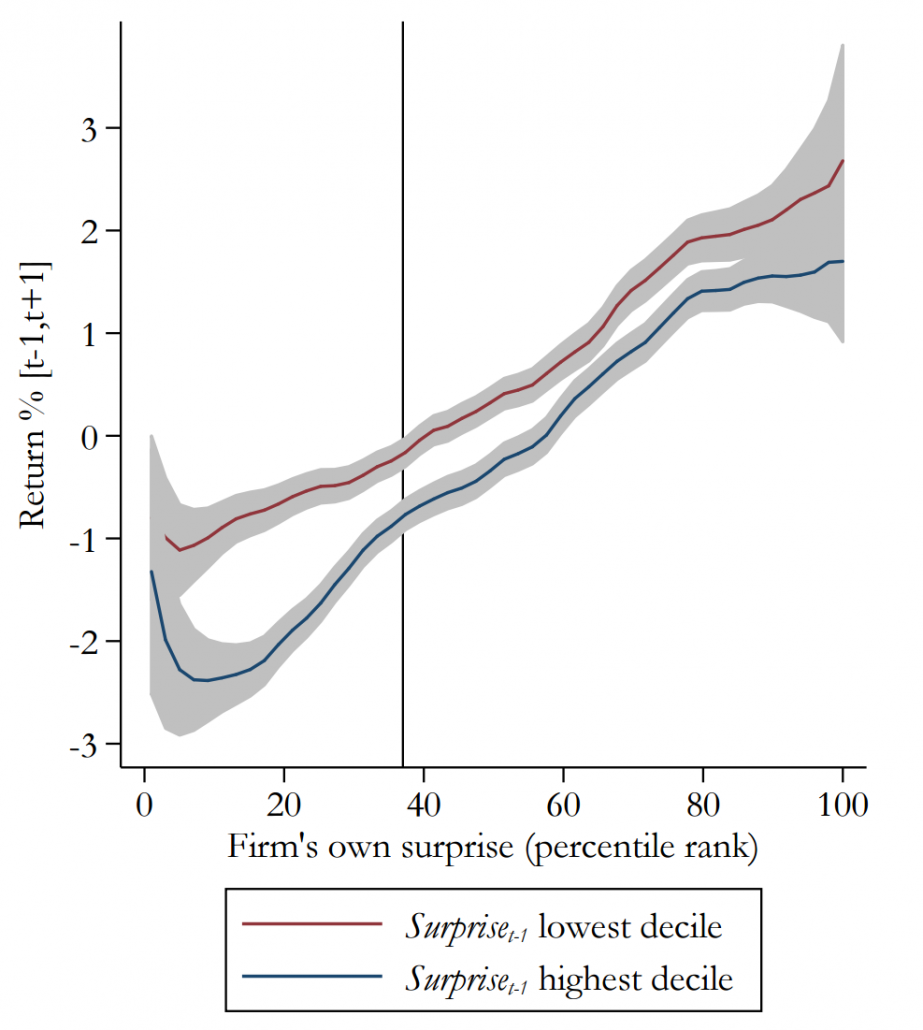
The authors look at the relationship between an earnings announcement made by firms today and the earnings surprises announced by “salient” firms the previous day. The “salient firms” used to measure the prior day’s earnings surprise are mega-cap, ultra-liquid firms. The core findings are as follows:
- Today’s news seems more impressive if yesterday’s surprises were bad.
- Today’s new seems less impressive if yesterday’s surprises were good.
Here is a visualization of the key result:

The results are hypothetical results and are NOT an indicator of future results and do NOT represent returns that any investor actually attained. Indexes are unmanaged, do not reflect management or trading fees, and one cannot invest directly in an index. Additional information regarding the construction of these results is available upon request.
Wait a Second…Isn’t this an information story?
My initial reaction to the core result was probably the result of many readers — this isn’t a behavioral effect, this is a market efficiency effect. The logic works as follows:
- Stock A and stock B share related fundamentals (e.g., same industry).
- Stock A always announces the day before stock B.
- Consider the following situation: Stock A announces good news today and this good news gets embedded in stock B today. When stock B announces tomorrow, regardless of the surprise, the reaction will be muted. On average, over the full time period (today + tomorrow) stock B’s return should be positive.
Perfectly logical, but there is a problem: the data doesn’t fit the story. The authors find a negative relationship between yesterday’s surprise and the total time period return (which should account for correlated news bumps), regardless of the direction of the surprise.
To make matters even more confusing, the empirically observed return relationship between the previous day’s earnings surprises and the reaction to today’s earnings surprises are reversed in the future, suggesting there is no information story, but rather, a behavioral story where market participants incorrectly price assets in the short run and this is gradually reversed over time. Fascinating.
Can Investors Exploit this Behavioral Bias?
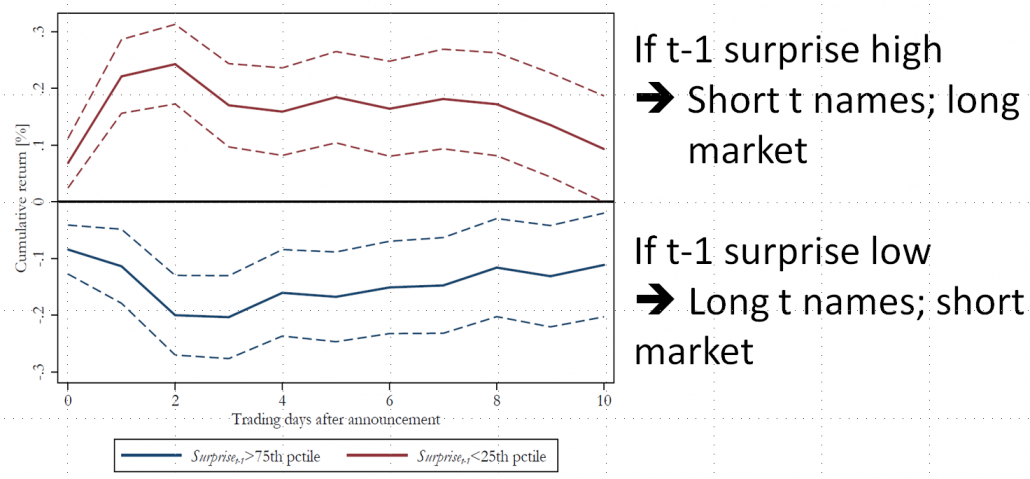
The authors pose a simple strategy to exploit the contrast bias:
- Long announcing firms at t if the surprise on large liquid firms was low the prior day; short the market.
- Short announcing firms at t if the surprise on large liquid firms was high the prior day; long the market.
- Value-weight the portfolio if there are at least 5 stocks.
- Hold for the announcement day t and t+1
The strategy looks promising at the outset. The figure below highlights that returns for announcers following low earnings surprises are positive (and vice versa following high earnings surprises):

The results are hypothetical results and are NOT an indicator of future results and do NOT represent returns that any investor actually attained. Indexes are unmanaged, do not reflect management or trading fees, and one cannot invest directly in an index. Additional information regarding the construction of these results is available upon request.
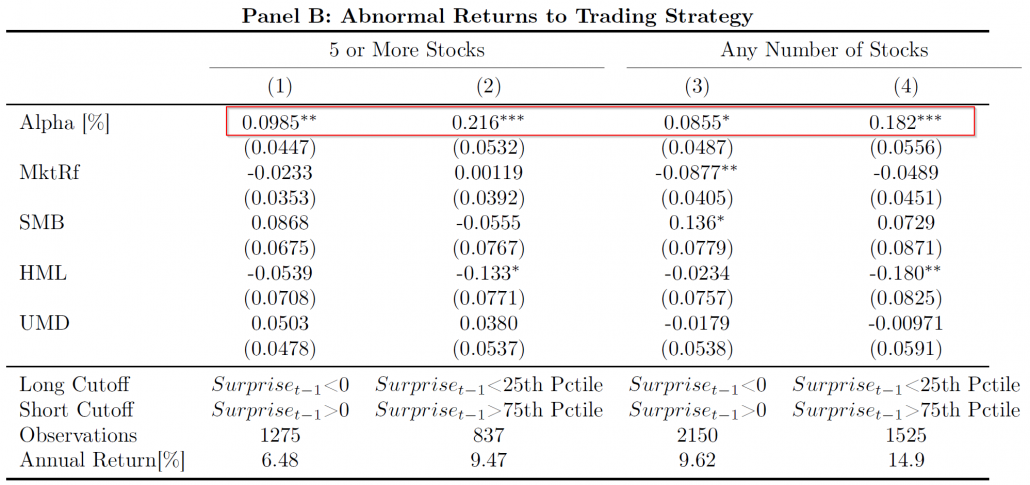
The authors build a trading strategy based on the chart above and post the formal “alpha” estimates for the strategy, which represent the average return after controlling for various “risk” exposures such as market exposure, size exposure, value exposure, and momentum exposure.

The results are hypothetical results and are NOT an indicator of future results and do NOT represent returns that any investor actually attained. Indexes are unmanaged, do not reflect management or trading fees, and one cannot invest directly in an index. Additional information regarding the construction of these results is available upon request.
The annual return estimates range from around 6% to almost 15%. Not bad for a market neutral strategy.
Where are the Smart Poker Players?
This paper is interesting and the empirical analysis is well thought out and they address alternative hypotheses. The result is clear: contrast effects probably matter. The evidence that this effect is exploitable is also compelling. However, there really isn’t a detailed discussion on the arbitrage constraints and/or an attempt at explaining why hedge funds and proprietary traders haven’t already exploited this anomaly. This sort of analysis would help the reader better understand if this anomaly is sustainable, such as value and/or momentum, or a “flash in the pan.” If there are true arbitrage constraints via portfolio risk, frictional costs, etc. then perhaps we’ll see this effect lasting a long time, however, if this is fairly straight forward to exploit, we would expect that this effect dissapates over time. Without a deeper investigation into the arbitrage restrictions we can’t address these questions (a deeper discussion on this topic is here).
Conclusion
There really haven’t been that many compelling new ideas in the academic journals these days. This paper is an exception. Sam and Kelly have delivered a great addition to the behavioral finance literature and I recommend that everyone read the source paper when they have time. I look forward to more research from this University of Chicago duo.
A Tough Act to Follow: Contrast Effects in Financial Markets
- Hartzmark and Shue
- A version of the paper can be found here.
- Want a summary of academic papers with alpha? Check out our Academic Research Recap Category.
Abstract:
We present evidence of sequential contrast effects in financial markets: investors mistakenly perceive information in contrast to what preceded it. We find that the stock price reaction to an earnings announcement is inversely related to the earnings surprise announced by large firms the previous day. A change in yesterday’s earnings surprise from the lowest to the highest decile corresponds to a 61 basis point lower return response to today’s earnings announcement. This effect is stronger among larger firms and cannot be explained by news conveyed through yesterday’s announcements, strategic timing of announcements, or changes in risk and trading frictions.
About the Author: Wesley Gray, PhD
—
Important Disclosures
For informational and educational purposes only and should not be construed as specific investment, accounting, legal, or tax advice. Certain information is deemed to be reliable, but its accuracy and completeness cannot be guaranteed. Third party information may become outdated or otherwise superseded without notice. Neither the Securities and Exchange Commission (SEC) nor any other federal or state agency has approved, determined the accuracy, or confirmed the adequacy of this article.
The views and opinions expressed herein are those of the author and do not necessarily reflect the views of Alpha Architect, its affiliates or its employees. Our full disclosures are available here. Definitions of common statistics used in our analysis are available here (towards the bottom).
Join thousands of other readers and subscribe to our blog.

