How do you handle repetitive tasks?
If you’re like most people, you work through a task in a variety of ways, find the most efficient approach, and then stick to that workflow. Consider email address autofill, automatic payment plans, or automatic renewal of magazine subscriptions. Because of behavior bias and the power of inertia (also known as the, “Yeah, whatever,” heuristic), it takes active effort for people to break away from such default settings.
Sticking with the status quo is arguably more powerful when the task is more complex. And complex, repetitive tasks are common in corporate life. Even C-level officers (CFO, CCO, CEO…) face numerous repetitive tasks. Consider financial reporting, where complex multi-hundred-page financial statements must be filed regularly, in a clockwork fashion. A good way to make a financial reporting task easier and more efficient is to apply a template, set defaults for some choices, and codify other parts when possible. Relying on a repeatable process is common in financial reporting, since it reduces the administrative burden.
There are many places where templates and default language meet reporting needs. Inertia is powerful. For example, in annual or quarterly reports, firms rarely make significant changes to, say, the structure of financial reporting templates or language that describes the business or the competition. Likewise, the Management Disucssion and Analysis (“MD&A”) section might have boilerplate language that is used repeatedly over time. Similarly, disclosed risk factors don’t usually change much from one quarter to the next. Firms demonstrate inertia by defaulting to language they have used previously.
But agents do depart from these standardized reporting templates at times, and when they do, they can make substantial changes to previously static language or well-codified text. And because these changes require new insights/thoughts, there is usually a good reason to depart from previous default language choices. Thus, when you see a big change in a firm’s financial filings, it suggests there may have been some material change in the business. And when a change is material, there may be information contained in the changes that has implications for future firm outcomes. Time to dig in.
But do investors actually dig in when there are changes in the language on large, primarily broilerplate, financial filings?
A new working papers suggests this may not be the case. In “Lazy Prices,” by Cohen, Malloy and Nguyen, the authors hypothesize that breaks from previous defaults and standardized reporting will have significant implications for firms’ future stock returns. To investigate this hypothesis, they compare the future stocks returns associated with firms who change their reports (“changers”), and compare these to the returns of firms who don’t make such changes (“non-changers”).
Changers vs. Non-Changers
The authors collect all complete 10-K, 10-K405, 10-KSB, and 10-Q filings from the SEC’s database from 1994 to 2014. Then they measure the quarter-on-quarter similarities between 10-Q and 10-K filings using four different similarity measures using language processing software: 1) cosine similarity, 2) Jaccard similarity, 3) minimum edit distance, and 4) simple similarity. (Quant geeks can refer to the paper for details).
The authors then sort the firms into five quintiles: Quintile 1 (Q1) refers to firms that have the least similarity between their documents this year and those from last year; the authors refer to these companies as “Changers.” Quintile 5 (Q5) represents firms whose docs are most similar to those that came before; they refer to this group as “Non-Changers.” Firms are held in the portfolio for 3 months. Portfolios are rebalanced monthly. They compare the future stock returns of “changers” to “Non-changers.”
The results show that “changers” are associated with lower future returns. In particular, a portfolio that goes long “non-changers” and short “changers” in annual and quarterly financial reports earns a statistically significant 30-60 bps per month — equivalent to up to 7.6% over the following year.
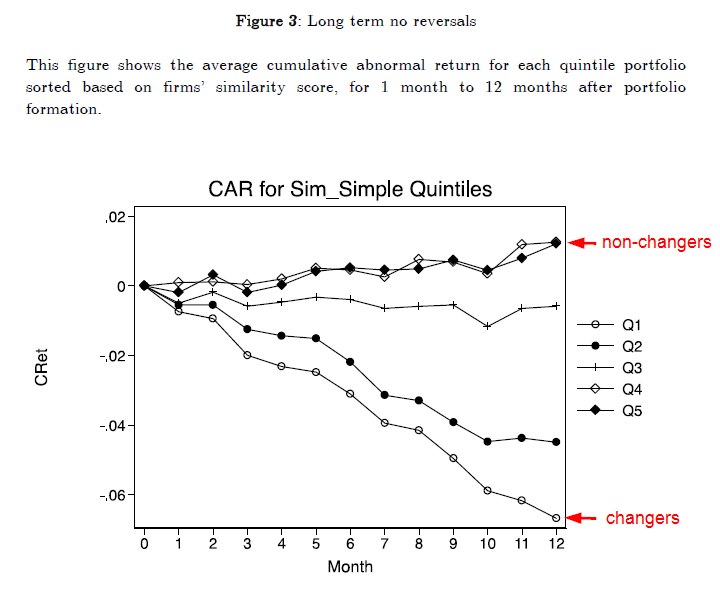
The below figure shows the average cumulative abnormal return (CAR) for each quintile portfolio after portfolio formation.

The results are hypothetical results and are NOT an indicator of future results and do NOT represent returns that any investor actually attained. Indexes are unmanaged, do not reflect management or trading fees, and one cannot invest directly in an index. Additional information regarding the construction of these results is available upon request.
It’s notable that the stock prices of the changers, which represent firms that have significantly altered their reporting, seem to suffer lasting effects that do not reverse.
The authors dig deeper into the effect and find that filing changes are largely concentrated in the management discussion (MD&A) section, which facilitates the most flexibility in terms of content.
However, text changes in the “Risk Factors” section, and the languages referring to CEO/CFO team, litigation and lawsuits are more informative for stock prices.

Example Risk Factor section from MSFT filing https://www.sec.gov/Archives/edgar/data/789019/000119312512316848/d347676d10k.htm
For instance, going long “non-changers” and short “changers” in the Risk Factors section earns a 5-factor alpha of 188 bps per month, or over 22% per year, and with healthy t-statistic of 2.76. This alpha estimate is much higher than the estimate associated with changes in other sections and may highlight investor limited attention in the stock market.

The results are hypothetical results and are NOT an indicator of future results and do NOT represent returns that any investor actually attained. Indexes are unmanaged, do not reflect management or trading fees, and one cannot invest directly in an index. Additional information regarding the construction of these results is available upon request.
Bottomline: avoid stocks that are making big changes to the Risk Factors section of their financial statements.
Implementation?
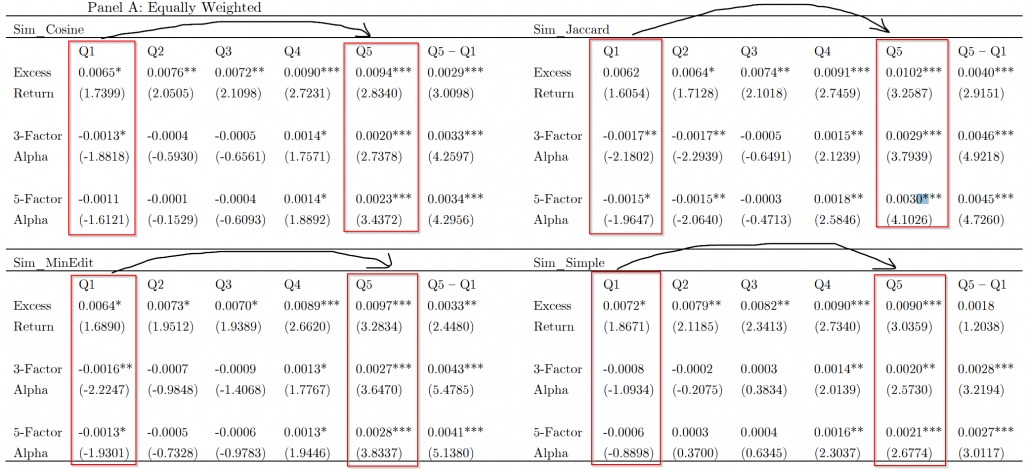
In theory, this looks like a great trading opportunity for an enterprising practitioner. Recall, however, that these returns are associated with a long/short strategy with presumably high turnover and transaction costs. So perhaps this strategy is not viable in the real world. That said, the mechanism identified would serve as a great screen for eliminating risky stocks from the potential buy list. In fact, when you look at the plain-vanilla long-only portfolio statistics for the “non-changers” (e.g., see the Q5 23bp 5-factor alpha estimate in the top left quadrant), the long book actually provides more than half of the mojo associated with the various long/short strategy portfolio formations:

The results are hypothetical results and are NOT an indicator of future results and do NOT represent returns that any investor actually attained. Indexes are unmanaged, do not reflect management or trading fees, and one cannot invest directly in an index. Additional information regarding the construction of these results is available upon request.
The quintile portfolio results highlight that the strategy is not driven by long/short portfolio analysis. The quintiles hint towards other ways in which an investor could use “lazy price” signals to benefit their portfolio. For example, an enterprising investor could own all firms that don’t change their risk factors section the least. For an investor with an itch to track closely to a broad index, one could buy all the stocks in the universe, market-cap-weight them, but avoid all big “changers.” The possibilities are really only constrained by your own creativity. Go explore and please share your insights in the comments of this post so others can learn.
Overall, this paper does a good job showing that there are abnormal returns associated with strategies that use the changes in the template language in financial filings as a trading signal. This suggests that important information in financial filings is slowly incorporated in to prices. Under the semi-strong efficient market hypothesis, this should not happen. In a behavioral world, this is not surprising.
Lazy Prices
- Cohen, Malloy and Nguyen (note, SSRN entry is incorrect as of 6/8/2016)
- A version of the paper can be found here.
- Want a summary of academic papers with alpha? Check out our Academic Research Recap Category.
Abstract:
We explore the implications of a subtle “default” choice that firms make in their regular reporting practices, namely that firms typically repeat what they most recently reported. Using the complete history of regular quarterly and annual filings by U.S. corporations from 1995-2014, we show that when firms make an active change in their reporting practices, this conveys an important signal about the firm. Changes to the language and construction of financial reports have strong implications for firms’ future returns: a portfolio that shorts “changers” and buys “non-changers” earns up to 188 basis points per month (over 22% per year) in abnormal returns in the future. These reporting changes are concentrated in the management discussion (MD&A) section. Changes in language referring to the executive (CEO and CFO) team, or regarding litigation, are especially informative for future returns.
About the Author: Wesley Gray, PhD
—
Important Disclosures
For informational and educational purposes only and should not be construed as specific investment, accounting, legal, or tax advice. Certain information is deemed to be reliable, but its accuracy and completeness cannot be guaranteed. Third party information may become outdated or otherwise superseded without notice. Neither the Securities and Exchange Commission (SEC) nor any other federal or state agency has approved, determined the accuracy, or confirmed the adequacy of this article.
The views and opinions expressed herein are those of the author and do not necessarily reflect the views of Alpha Architect, its affiliates or its employees. Our full disclosures are available here. Definitions of common statistics used in our analysis are available here (towards the bottom).
Join thousands of other readers and subscribe to our blog.


