My last post, “Will bonds deliver crisis alpha in the next crisis?,” created quite a stir on the blogosphere. The underlying assumption of the analysis is that stocks are a core component of a portfolio and bonds are included to diversify the portfolio. The key takeaway from my analysis is that the crisis alpha associated with bond exposures seems to be driven by the income component of bond returns. The implication from the analysis is that bonds may provide less crisis alpha in the future because they have a low level of income at current yields (i.e., 10-year Treasury bond YTM is 1.57% as of 6/16/2016!).
In other words, past performance may not be indicative of future performance.
Asking a Different Question: Will stocks deliver crisis alpha…for bonds?
I gleaned a few insights after sharing the research. First, the post inspired way more conversation than I expected. And second, the follow-on conversations inspired more questions that still need to be answered. For example, Rick Ferri, the founder of PortfolioSolutions, embodied the classic Charlie Munger advice to “invert, always invert” when he mentioned that bonds might BE the next crisis.
With Rick’s thought buried in my brain, I wanted to ask the question, “Do stocks diversify bonds?”
The first task in answering the question, Do stocks diversify bonds, is to define what we mean by “diversification.” For this question, we will look at the fifty worst months of excess returns (total return minus the return of cash) for bonds and study the performance of the US stock market during those fifty worst months. I try to avoid the use of the term “crisis alpha” so that it continues to mean times of really bad stock market returns: many people would not define a “crisis” as when the bond portion of their portfolio performs unusually poorly…that just doesn’t seem as scary. If US stocks perform well when bond returns are bad and the performance of US stocks is consistently positive when bond returns are bad (i.e., positive excess return in more than 50% of months), then it might be safe to conclude that stocks provide good diversification for bonds.
Data Used
For this analysis we use Ibbotson Associates Long-Term US Government Bond TR index for bonds (~20 year duration), Ibbotson Associates US Large Cap Stocks TR index for stock returns and Ibbotson Associates 30 Day T-bill TR for the return of cash. Indexes are unmanaged, do not reflect management or trading fees, and one cannot invest directly in an index. Unless otherwise specified, all monthly returns are arithmetic averages and all returns are excess returns (total return for the month less the return of cash for the month or “ER”). The data period is from 1/1926 to 4/2016.
Bad Times for Bonds
Although the definition of a bad month for bond returns might vary, we use the worst fifty months. Since there are 1,084 months in the date range, we are looking at the bottom 5% (rounded) of historical bond returns.
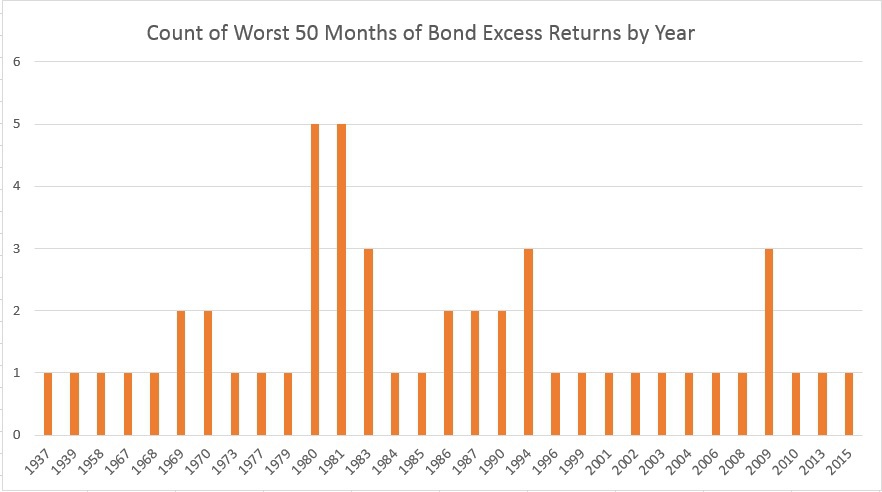
If you are like me, I was expecting to see a lot of months in the later 1970s and early 1980s, which might make any conclusion from this analysis suspect. Surprisingly, that isn’t the case. I show the frequency of bad bond months by year in the graph, below:

The results are hypothetical results and are NOT an indicator of future results and do NOT represent returns that any investor actually attained. Indexes are unmanaged, do not reflect management or trading fees, and one cannot invest directly in an index. Additional information regarding the construction of these results is available upon request.
As you can see from the graph, 1980 and 1981 were a bad time for bond returns. However, the bad months for bonds are pretty evenly spread throughout history.
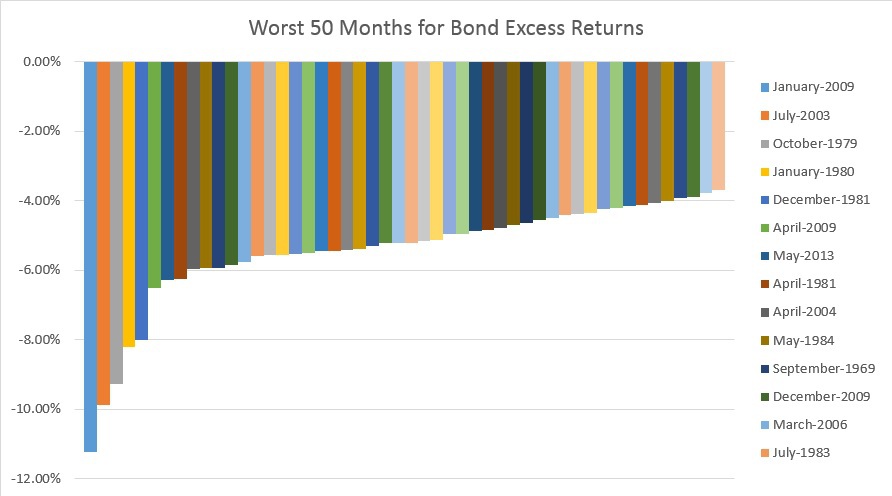
So what have “bad months” for bonds looked like return wise?

The results are hypothetical results and are NOT an indicator of future results and do NOT represent returns that any investor actually attained. Indexes are unmanaged, do not reflect management or trading fees, and one cannot invest directly in an index. Additional information regarding the construction of these results is available upon request.
The single worst month was January 2009 with an excess return of -11.24%–that is pretty surprising!
There are several more months with excess returns between -9% to -6% and then the rest of the bad months have excess return of -5% to -3.5%.
US Stock Performance During Bad Months for Bonds
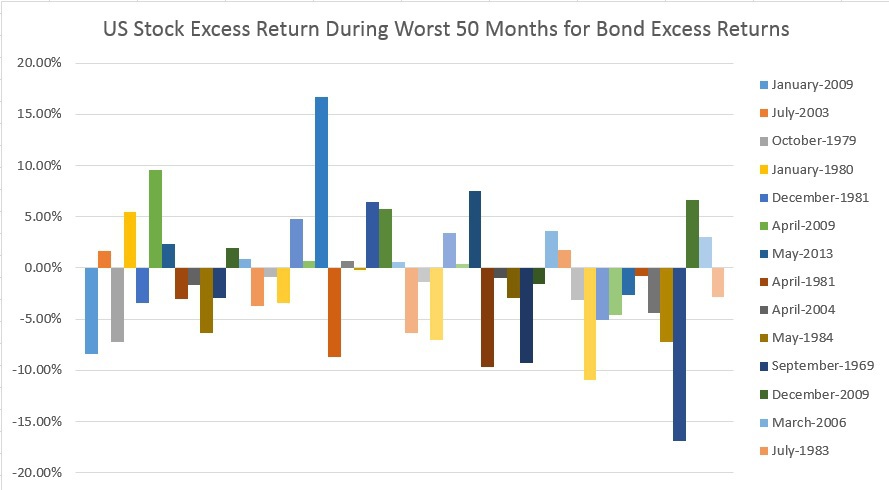
Historically, stocks have averaged an excess return of -1.66% during bad months for bonds with only 20 of the 50 months producing positive excess returns. I show a graph of those stock returns, below (the dates are in the same order as the graph, above):

The results are hypothetical results and are NOT an indicator of future results and do NOT represent returns that any investor actually attained. Indexes are unmanaged, do not reflect management or trading fees, and one cannot invest directly in an index. Additional information regarding the construction of these results is available upon request.
We see that the negative excess returns for stocks isn’t dominated by a handful of really bad months and it isn’t contained to a particular period of time.
These results highlight that stocks are a reasonable diversifier when bonds have bad months. When bonds are bad, stocks are often bad, on average. All that said, stocks do not provide a slam-dunk diversification benefit for bond holdings (i.e., strongly negatively correlated).
Implications for Investors
This is (obviously) not a comprehensive list of implications, but are some of the first ones that cross my mind:
- If bonds are the next crisis, traditional stock and bond portfolios may perform poorly irrespective of the stock and bond allocation mix.
- This analysis would certainly make me a bit more skepitcal of risk parity or min-variance algorithms that typically load up and/or lever on bonds.
- If the diversifier in your portfolio (bonds) have a bad month and your return generator (stocks) tends to perform poorly at the same time, is your portfolio really diversified?
- If stocks and bonds tend to have poor performance at the same time, this indicates that they may share a non-diversifiable common risk factor that generic correlation analysis doesn’t highlight.
Unfortunately, the analysis above highlights that we may need to think harder about asset allocation in the future. Ideally we make things as simple as possible, but this is not always possible. A generic 60/40 portfolio may not provide the answer to portfolio problems like it has over the past 30 years. Portfolios should probably seek broader diversification, when possible, and if the fees/taxes/liquidity can be managed effectively.
About the Author: Andrew Miller
—
Important Disclosures
For informational and educational purposes only and should not be construed as specific investment, accounting, legal, or tax advice. Certain information is deemed to be reliable, but its accuracy and completeness cannot be guaranteed. Third party information may become outdated or otherwise superseded without notice. Neither the Securities and Exchange Commission (SEC) nor any other federal or state agency has approved, determined the accuracy, or confirmed the adequacy of this article.
The views and opinions expressed herein are those of the author and do not necessarily reflect the views of Alpha Architect, its affiliates or its employees. Our full disclosures are available here. Definitions of common statistics used in our analysis are available here (towards the bottom).
Join thousands of other readers and subscribe to our blog.

