A long-time reader asked that we examine the performance and process associated with the Dorsey Wright Focus Five ETF (ticker: FV). For those who are unfamiliar with the product, FV is a $3B+ sector rotation fund. The fund is designed to provide targeted exposure to five sector- and industry-based ETFs that Dorsey, Wright & Associates (DWA) believes offer the greatest potential to outperform other ETFs in the selection universe and that satisfy trading volume and liquidity requirements.
As many of our readers already know, relative strength momentum strategies are certainly interesting (eg. here and here) . However, as is the case with all strategies that “work,” they often call on investors to endure extreme pain. FV is no exception–a recent piece from Barron’s says it all:
Investors who likely were hoping for a nimble, quasi-active investment strategy might be surprised to learn that FV’s largest holding was permitted to fall nearly 40% since last summer before getting the boot.
Eating a drawdown of almost 40% is always tough. But high volatility is a harsh reality when it comes to momentum-based strategies (although trend-following can help). See the chart from Meb’s paper on relative strength:

Source: Meb Faber’s paper on relative strength. The results are hypothetical results and are NOT an indicator of future results and do NOT represent returns that any investor actually attained. Indexes are unmanaged, do not reflect management or trading fees, and one cannot invest directly in an index. Additional information regarding the construction of these results is available upon request.
But this post isn’t about explaining why sector momentum funds have had poor relative performance (at least recently). Poor relative performance is part of the active management landscape and should be expected if an active manager is delivering active risk and not a closet-indexing exposure.
The fact that FV has gotten pummeled on a relative basis is, ironically, an argument in favor of the long-term sustainability of sector-momentum strategies. Why? Active strategies need episodes of “this doesn’t work any more” pessimism to ensure they can possibly work in the future (See our sustainable active investing framework for a detailed explanation).
So, to reiterate, this post isn’t about FV’s recent performance and we have no strong opinion–it is what it is. Sometimes it will work, sometimes it won’t.
Instead, this post is about exploring the FV methodology and identifying how close the methodology tracks generic relative-strength rotation strategies.
Bottom line: We find that there are potentially simple ways to achieve goals that are similar to FV, but the time period is short so any conclusions should be taken with a grain of salt.
Introducing the Dorsey Wright Focus 5 Methodology
First, an introduction to the methodology deployed for the Dorsey Wright Focus 5 strategy. (note: DWA stands for Dorsey Wright and Associates)
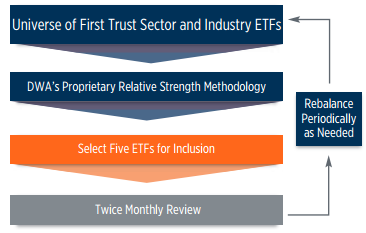
The detailed methodology is here, which we summarize below:
- Universe: DWA has selected various First Trust sector and industry ETFs as the potential universe.
- Point & Figure Relative Strength Chart: A point & figure relative strength chart is created for each relationship between each sector-based ETFs within the inventory. A point & figure relative strength chart is a variation of a point & figure chart.
- Relative Strength Matrix: DWA creates a relative strength matrix (the “matrix”) that systematically analyzes the various point & figure relative strength charts.
- Rankings: For each ETF in the inventory, the matrix is ranked such that the ETF with the highest number of Buy signals is ranked No. 1.
- Rebalance: The relative strength analysis is conducted bi-monthly. ETFs are replaced when they fall out of favor, based on their relative strength, versus the other ETFs within the universe. The index is rebalanced so that each position is equal weighted.
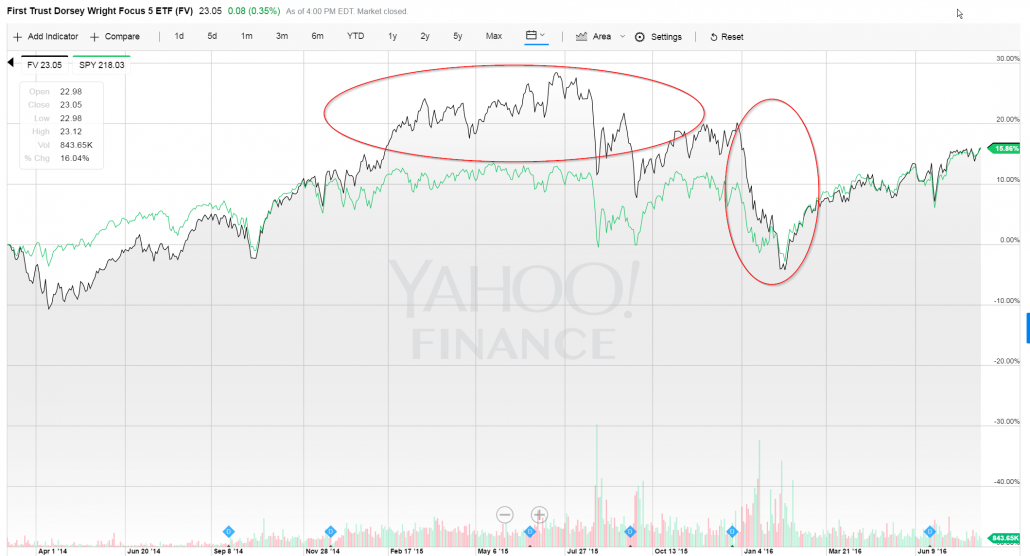
The below chart shows the price movements of FV from 1/1/2014 to 8/8/2016.
We can see that performance has been across the board. The recent cliff-diving drawdown has scared many FV investors from ever touching momentum ever again. But poor short-term performance doesn’t mean that a process and/or exposure is not worthwhile for investors. Momentum exposures — either the stock selection variety or the sector version — should probably be a part of all investors portfolios, based on the historical evidence. And based on the chart, the fact that FV bounces all around he generic market index, is actually a good sign that the system is not a closet-indexing exposure. This active risk around the index suggests that a sector momentum exposure could play a diversification role in a portfolio with generic passive index exposure. Of course, even if the FV exposure is potentially attractive, we must look and see if there are other ways to get FV-like exposure. We examine this in the next section.
A Simple Sector-Momentum Backtest
We run a simplified version of the DWA strategy that includes the 14 First Trust ETFs used in the DWA universe:
Model Inventory — 14 Sector and Industry ETFs
- First Trust NYSE Arca Biotechnology Index Fund (FBT)
- First Trust Dow Jones Internet Index Fund (FDN)
- First Trust Consumer Discretionary AlphaDEX® Fund (FXD)
- First Trust Consumer Staples AlphaDEX® Fund (FXG)
- First Trust Health Care AlphaDEX® Fund (FXH)
- First Trust Financials AlphaDEX® Fund (FXO)
- First Trust Utilities AlphaDEX® Fund (FXU)
- First Trust Energy AlphaDEX® Fund (FXN)
- First Trust Industrials/Producer Durables AlphaDEX® Fund (FXR)
- First Trust NASDAQ-100 Ex-Technology Sector Index Fund (QQXT)
- First Trust NASDAQ-100-Technology Sector Index Fund (QTEC)
- First Trust S&P REIT Index Fund (FRI)
- First Trust Technology AlphaDEX® Fund (FXL)
- First Trust Materials AlphaDEX® Fund (FXZ)
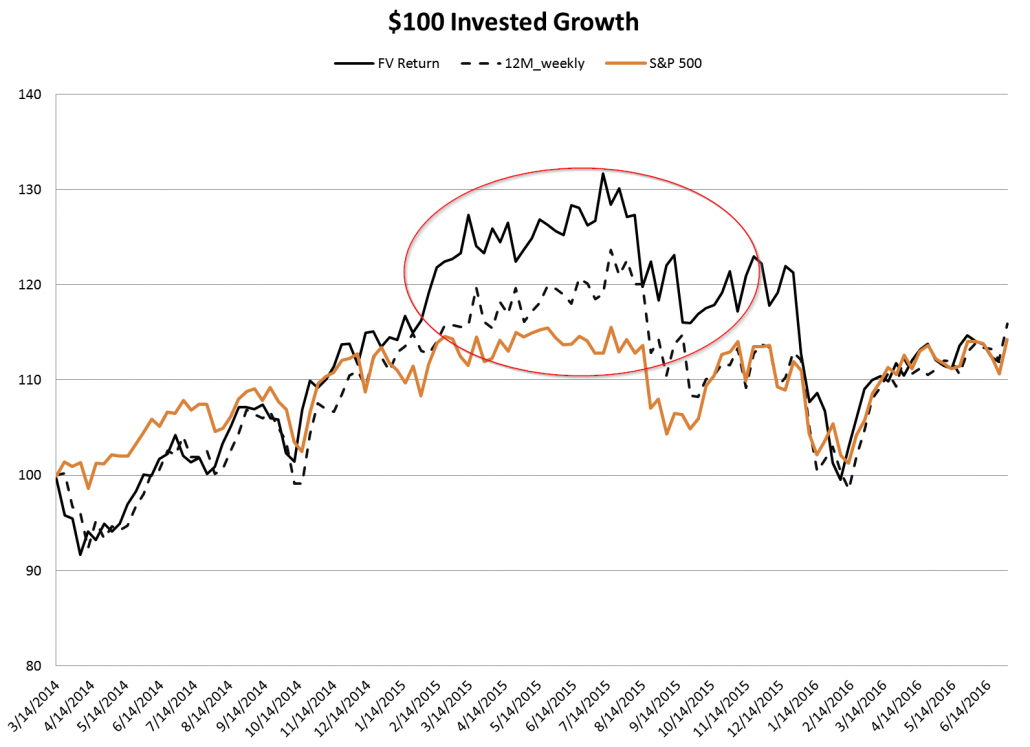
To keep things simple we equal-weight allocations and conduct a weekly rebalance. Specifically, at the end of each week, we allocate capital to the top 5 ETFs (out of 14) with the highest return over the past 12 months. We use weekly dividend-adjusted closing prices for these 14 ETFs. FV live data is available from 3/14/2014 to 6/30/2016. We don’t include transaction costs, which would handicap the performance if this strategy was implemented in real life.
Here is a legend:
- S&P 500 = SPY ETF total return
- FV Return = FV ETF total return
- 12M_weekly = Simple weekly-rebalanced sector rotation strategy allocated to the top 5 12-month momentum sectors
The invested growth chart is plotted below:

The results are hypothetical results and are NOT an indicator of future results and do NOT represent returns that any investor actually attained. Indexes are unmanaged, do not reflect management or trading fees, and one cannot invest directly in an index. Additional information regarding the construction of these results is available upon request.
FV offered strong performance from 3/14/14 through the end of calendar 2015, but had a tough stretch thereafter. The simple replication strategy showed a similar growth path, save the FV performance streak in early 2015. Overall, FV and the replication strategy act similarly, but to say they are the same would be an overstatement. There is arguably something unique to the DWA process and it is on investors to determine whether this “uniqueness” is better than a simple sector-momentum strategy. We can’t form an opinion on this matter because we do not have enough information on the underlying DWA process to ascertain if it “adds value.” If any readers have a better grasp on this subject, please share the results in the comments section.
Conclusion
Based on recent history, investors should have thrown their hands in the air when it came to almost all active strategies. Buying a passive index exposure has gotten you ahead of the game the past few years. Will this continue? Who knows. We’re still long-term buyers of active value and momentum exposures, but these active strategies are certainly not for everyone.
Best of luck.
About the Author: Wesley Gray, PhD
—
Important Disclosures
For informational and educational purposes only and should not be construed as specific investment, accounting, legal, or tax advice. Certain information is deemed to be reliable, but its accuracy and completeness cannot be guaranteed. Third party information may become outdated or otherwise superseded without notice. Neither the Securities and Exchange Commission (SEC) nor any other federal or state agency has approved, determined the accuracy, or confirmed the adequacy of this article.
The views and opinions expressed herein are those of the author and do not necessarily reflect the views of Alpha Architect, its affiliates or its employees. Our full disclosures are available here. Definitions of common statistics used in our analysis are available here (towards the bottom).
Join thousands of other readers and subscribe to our blog.


