Low volatility funds are some of the best performers in the market these days. As such, they have attracted renewed attention in addition to significant asset flows. (note: a refresher on low volatility investing is here, h.t. Eric Falkenstein).
But a question remains — What does the future hold for low volatility performance?
Predictions are really difficult, especially about the future. Nonetheless, academic researchers continue to develop and test new insights.
In “The Booms and Busts of Beta Arbitrage,” by Huang, et al., the authors study how “smart money,” or arbitrageurs, try to exploit the so-called low volatility anomaly through, as the authors refer to it, “beta arbitrage.” Turns out that the performance of low volatility strategies might be predictable based on the activity of smart money. Here is a quote from the paper:
In times of low activity, the beta-arbitrage strategy exhibits delayed correction, taking up to three years for abnormal returns to be realized. In stark contrast, when activity is high, prices overshoot as short-run abnormal returns are much larger and then revert in the long run.
In other words, if a lot of capital is chasing the anomaly the returns are great in the short run, but they eventually crash (seems to be close to the current situation). On the other hand, when nobody is paying attention to low volatility the returns are kinda “blah” in the short run, but do earn their keep over time (similar in spirit to value strategies, which we already knew).
Another quote from the paper may serve as a nugget of wisdom for tactical low volatility investors:
…our findings are consistent with arbitrageurs exacerbating this time-variation in the expected return to beta arbitrage.
A Quick Primer on the Low Volatility Anomaly
Here on our blog, we’ve spent quite a bit of time examining this intriguing anomaly. For instance, we discussed here and here how the performance of low volatility is closely related to the value anomaly. Here we examined two popular “flavors” of the low vol anomaly, which are expressed using 1) idiosyncratic volatility, and 2) beta.
“Rebellious” academic researchers love to discuss the low-vol premium, since it is inconsistent with CAPM theory, a cornerstone of modern portfolio theory. For instance, Frazzini and Pedersen (2010) (and Blitz and Vliet 2007) provide empirical evidence that a long levered low-beta and short high-beta stock strategy performs well among U.S. equities, 18 international equity markets, and alternative markets. Why? Investors tend to “tilt” towards risky high-beta assets, which implies that these require lower risk-adjusted returns than low-beta assets. Consequently, lower risk stocks (at least as defined by CAPM) earn similar returns than higher risk stocks. Say what? Yes, lower risk stocks earn roughly the same return as higher risk stocks (sidenote: in international markets lower risk stocks have earned higher returns! See Tables 3/4 in the Frazzini and Pedersen paper).
Research recap:
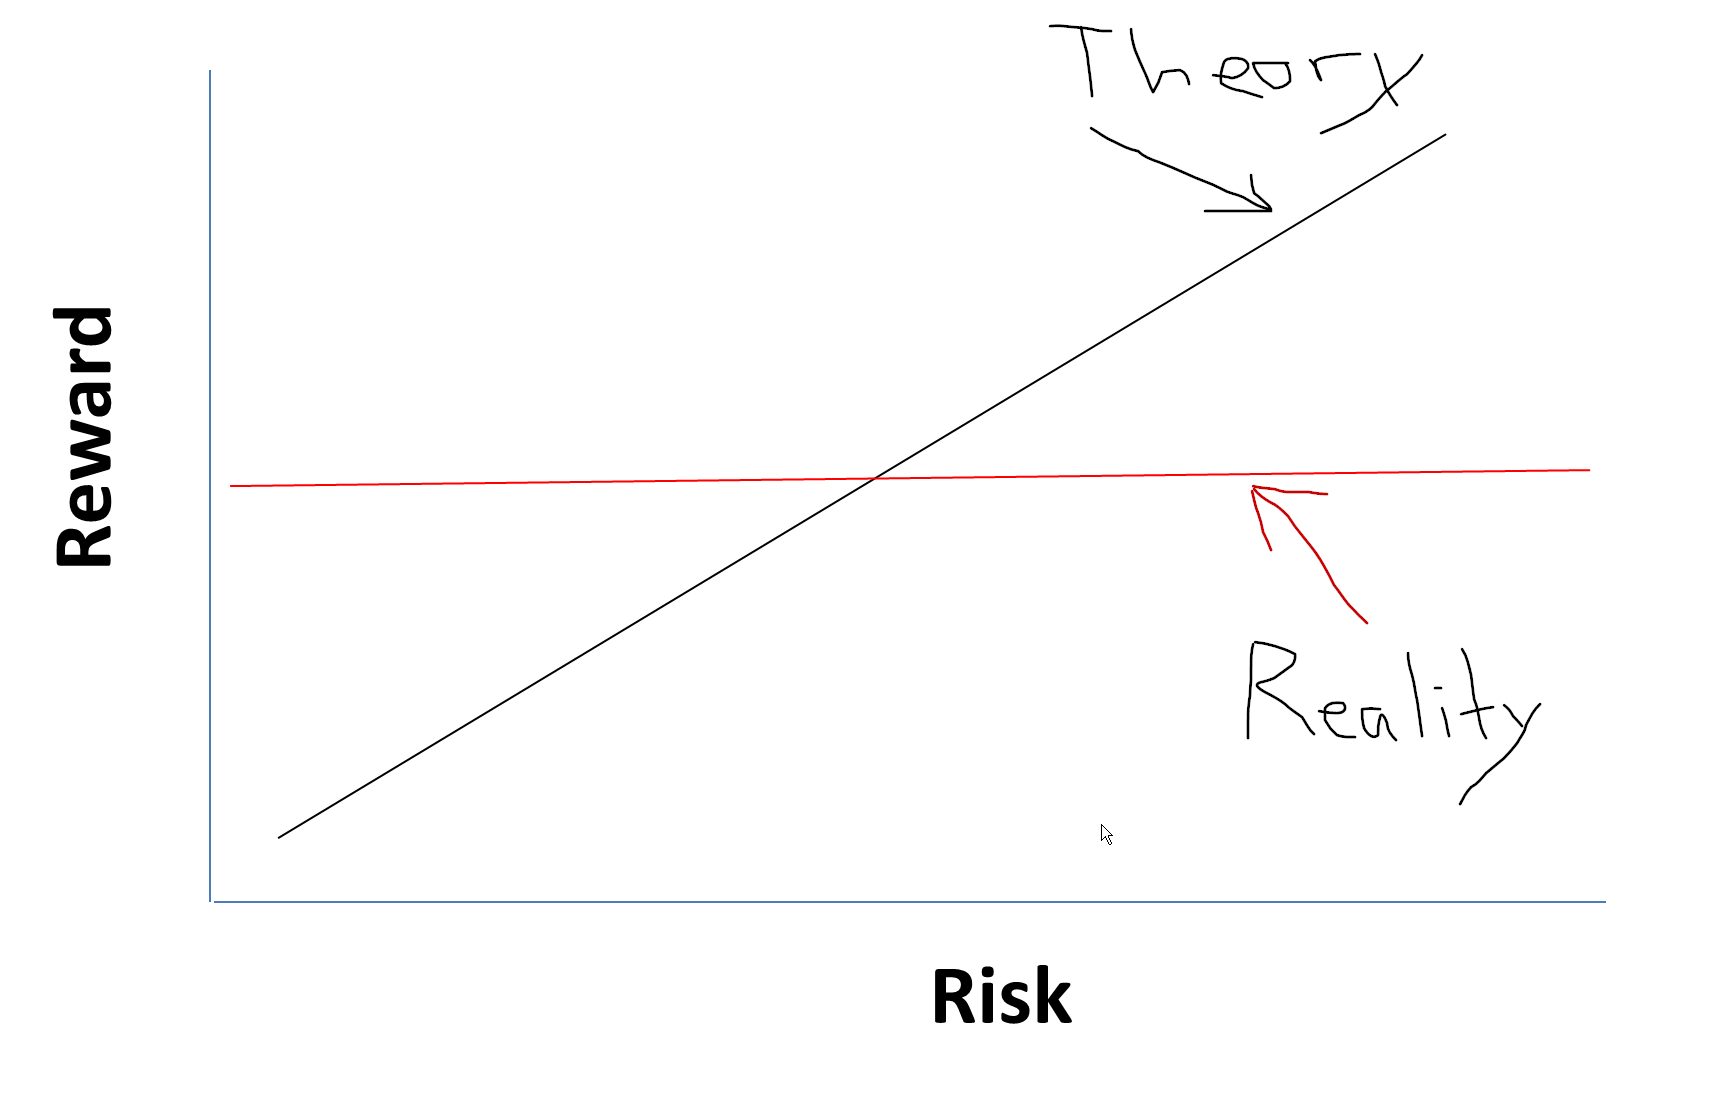
Weird.
The research seems to suggest that this odd effect is driven by a lottery preference by investors (see here and here) and some element of limited arbitrage. This research seems reasonable in explaining the low volatility anomaly, but there are others who might claim the low volatility anomaly is a data-mining artifact (perhaps unreasonably). For argument’s sake, let’s assume low volatility is a real phenomenon. Now let’s dig into the dynamics of the strategy.
How to Measure the “beta Arbitragers?”
“Beta arbitrage premiums,” generated by holding low-beta stocks and selling high-beta stocks, have been applied by Fund/ETF providers for years (examples are the PowerShares S&P 500 Low Volatility Portfolio, AQR low-vol funds, etc.).
The question raised by Huang et al. is whether trends in arbitrage activity might somehow explain the timing of excess comovement of low beta stocks.
Beginning in 1970, the researchers calculate betas using daily returns over the past twelve months (example calcs here). Then they form arbitrage portfolios that go long a value-weight portfolio of stocks in the lowest market beta decile and short a value-weight portfolio of stocks in the highest market beta decile. Next they create a proxy for beta arbitrage, which they can compare to these low vol portfolios.
In order to develop the proxy, the paper leverages prior studies on beta-arbitrage, selecting regression variables that have demonstrated predictive power in estimating future beta-arbitrage strategy returns:
- Expected inflation index (defined as the exponential moving average CPI growth rate over the past 100 months)
- Sentiment index (proposed by Baker and Wurgler, 2006, 2007)
- Aggregate disagreement proxy (the beta-weighted standard deviation of analysts’ long-term growth rate forecast), following Hong and Sraer
- The “Ted spread” – the spread between the LIBOR rate and the US treasury bill rate, following Frazzini and Pedersen (2014), reflecting funding constraints of intermediaries
Note: to account for illiquidity and non-synchronous trading, the regression also includes a past market liquidity factor (Pastor-Stambaugh liquidity factor), and contemporaneous excess market return.
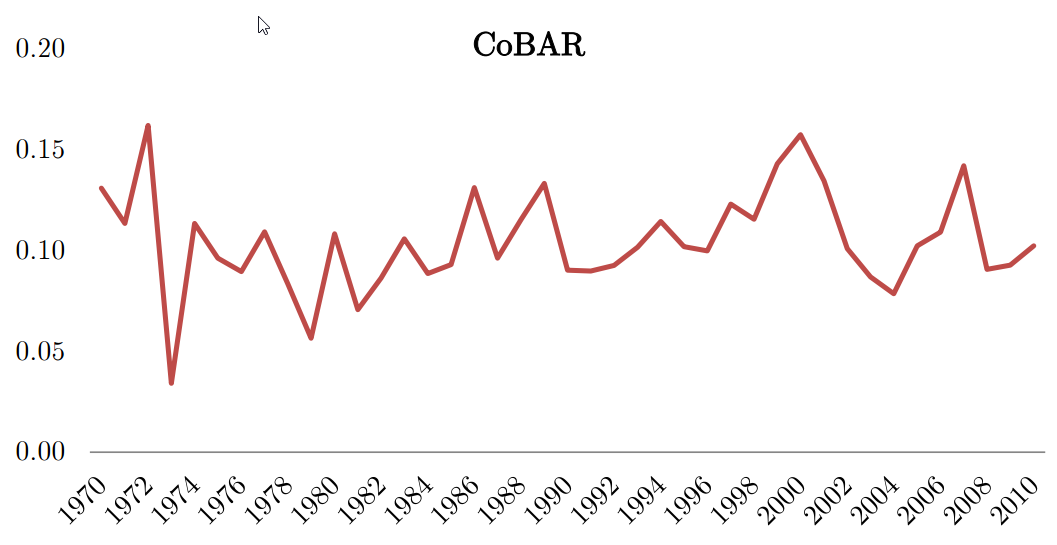
The regression is designed to capture the excess comovement of stocks involved in beta arbitrage activities, or “CoBAR,” within the low beta decile. The excess comovement is defined as the “average pairwise partial correlation in the lowest market beta decile.” A higher CoBAR generally means more beta-arbitrage activities, while a lower CoBAR means lower beta-arbitrage activities.
The study finds that the pairwise correlation mean of CoBAR is 0.11, with a minimum of 0.03 and a maximum of 0.20. Furthermore, CoBAR seems persistent through time and demonstrates cyclicality, peaking before broad market declines:
As a sanity test, the researchers estimate regressions forecasting CoBAR with variables that often proxy for arbitrage activity: 1) institutional ownership, 2) assets under management of long-short equity hedge funds, and 3) aggregate liquidity. The R-squared on the regression is 38%, suggesting that CoBAR is indeed related to arbitrage activity, at least based on traditional proxies.
Next, the paper tracks the performances of a zero-cost long-short portfolio from 1 month through 3 years after formation. All months are classified into five groups based on CoBAR.
Let’s see how beta-arbitrage performs across different arbitrage regimes:
- The table below shows that when arbitrage activity is relatively low (low CoBAR), abnormal returns on beta-arbitrage strategies take much longer to realize (2-3 years after formation).
- By contrast, when arbitrage activity is relatively high (high CoBAR), abnormal returns on beta-arbitrage strategies occur quickly, within the first 6 months of the trade. But these also encounter reversals in the long-term.
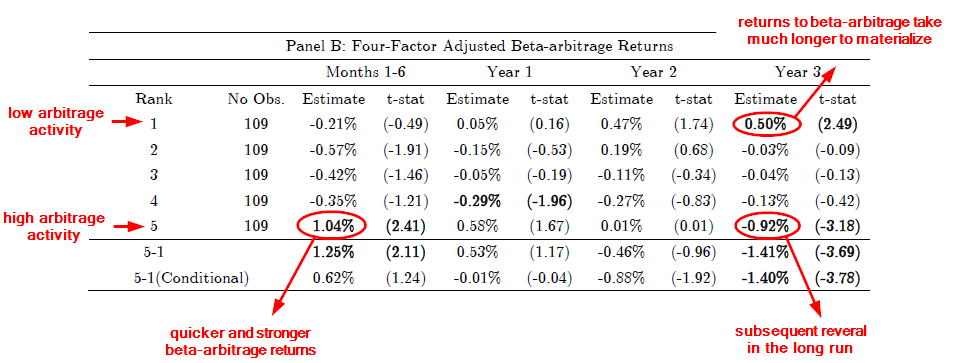
The results are hypothetical results and are NOT an indicator of future results and do NOT represent returns that any investor actually attained. Indexes are unmanaged, do not reflect management or trading fees, and one cannot invest directly in an index. Additional information regarding the construction of these results is available upon request.
The graph below visually depicts the results from the table above:
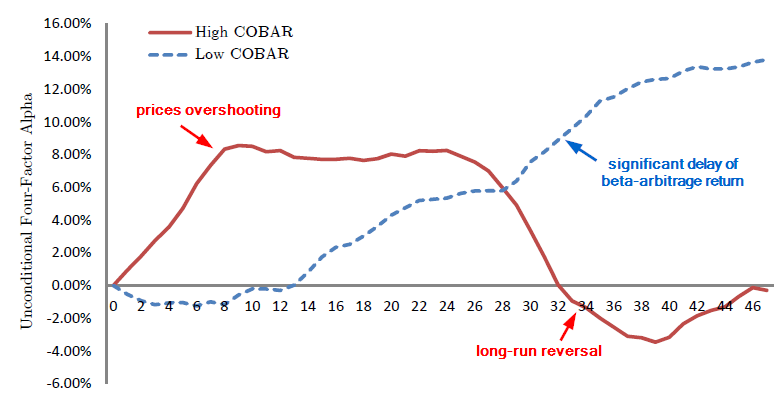
The results are hypothetical results and are NOT an indicator of future results and do NOT represent returns that any investor actually attained. Indexes are unmanaged, do not reflect management or trading fees, and one cannot invest directly in an index. Additional information regarding the construction of these results is available upon request.
In short, there appears to be time-variation in expected returns to low vol strategies, and these variations may be related to arbitrage activities. The authors also suggest that beta arbitrage may be susceptible to positive-feedback trading, but perhaps this is a topic for another blog post!
Concluding thoughts
Personally, I would have liked to see how valuations played into this analysis. More specifically, when low vol stocks get expensive relative to high vol stocks, how does this affect the dynamic of the expected returns in the future? One might suspect that relative valuations could more simply capture arbitrage activity than the fancier methods deployed in this paper. Of course, this sort of research has already been done and we’ve covered it in detail in the past, so maybe the authors were going for a different angle. Regardless, the paper is really interesting and might have implications for investors who look at low volatility stock strategies via the tactical lens.
The Booms and Busts of Beta Arbitrage
- Huang, Lou and Polk
- A version of the paper can be found here.
- Appendix information is here
- Want a summary of academic papers with alpha? Check out our Academic Research Recap Category.
Abstract:
Low-beta stocks deliver high average returns and low risk relative to high-beta stocks, an opportunity for professional investors to “arbitrage” away. We argue that betaarbitrage activity instead generates booms and busts in the strategy’s abnormal trading profits. In times of low activity, the beta-arbitrage strategy exhibits delayed correction, taking up to three years for abnormal returns to be realized. In stark contrast, when activity is high, prices overshoot as short-run abnormal returns are much larger and then revert in the long run. We document a novel positive-feedback channel operating through firm-level leverage that facilitates these boom and bust cycles.
About the Author: Wesley Gray, PhD
—
Important Disclosures
For informational and educational purposes only and should not be construed as specific investment, accounting, legal, or tax advice. Certain information is deemed to be reliable, but its accuracy and completeness cannot be guaranteed. Third party information may become outdated or otherwise superseded without notice. Neither the Securities and Exchange Commission (SEC) nor any other federal or state agency has approved, determined the accuracy, or confirmed the adequacy of this article.
The views and opinions expressed herein are those of the author and do not necessarily reflect the views of Alpha Architect, its affiliates or its employees. Our full disclosures are available here. Definitions of common statistics used in our analysis are available here (towards the bottom).
Join thousands of other readers and subscribe to our blog.