Over the past several decades, academics have identified numerous variables that seem to predict future expected returns. This has led to a proliferation of so-called “factors” identified in the literature, and created what John Cochrane has labeled the “factor zoo.”
Now we we have a zoo of new factors.
–The Journal of Finance 2010 Presidential Address
Enter the zoo at your own risk — the animals all look pretty, but they might end up killing you!

In this post we discuss how to conduct basic factor analysis. Previously, we wrote this post on “anomaly chasing” and how many anomalies suffer from data mining.
While some academics like to chase new anomalies, others have focused on why certain limits to arbitrage may prevent these market inefficiencies from being arbitraged away by traders. Such limits to arbitrage can take many forms.
Questioning Assumptions
For example, in studying the anomalies, researchers often make assumptions that turn out to be unrealistic in the real world. For example, some research has focused on how price impact and transaction costs can reduce returns to factor-based strategies:
- Korajczyk and Sadka (2004) found that price impact reduces abnormal returns when portfolio size is increased
- Hanna & Ready (2005) found that excess returns for a long-short strategy (using > 50 measures) were not attractive after accounting for transaction costs
- Richardson, Wysocki and Tuna (2010) analyzed how transaction costs affected the accrual anomaly and post-earnings-announcement drift
These studies suggest that strategies identified in academia don’t always translate directly into profitable trading strategies, because sometimes the assumptions used — such as costless trading — don’t hold up in the real world (although some research suggests trading costs can’t explain everything). Of course, there are many other assumptions worth examining.
In a new paper, “The costs and benefits of long-short investing: A perspective on the market efficiency literature,” by Beaver, NcNichols and Price (note: Professor Price is a member of our advisory team), the authors turn a critical eye on a number of additional assumptions that academics use when they study anomalies and trading costs.
The paper examines:
- The costs and benefits of long/short investing, as compared with long-only investing
- How combinations of/diversifying across various long/short strategies, and long-only strategies affects performance
- Strategy profitability after assessing an opportunity cost of capital
Data and Strategies
In order to conduct their analysis, the authors use a sample of firms in Compustat listed on the NYSE, AMEX, and Nasdaq for the period 1992-2011, and choose five anomalies:
- Book-to-market ratio (BM)
- Operating cash flow, scaled by assets (CF)
- Accruals, scaled by assets (AC)
- Unexpected earnings, which is change in earnings of quarter t and quarter t-4 deflated by quarter t-4 (UE)
- Change in net operating assets, scaled by assets (ΔNOA)
Portfolios are formed quarterly, and held for twelve months. In order to mimic the approach taken by academics, the authors create two portfolios of stocks: 1) a long portfolio and 2) a short portfolio.
While the long book is straightforward, the creation of a short in the real world is significantly more complex than you might think from reading an academic paper.
Long-Short Strategies (and Especially Short Books) Are Murder in the Real World
Running a short book poses numerous challenges in the real world, and the authors dissect these difficulties and contrast them with the traditional academic treatment.
For instance, to create short positions, one needs to locate and borrow shares; this in itself is problematic, since sometimes shares are simply not available to borrow. Another difficulty is that short positions cannot be held indefinitely; sometimes shorts get recalled by the lender (this happened to me in 2008!). Although these issues are reduced in large, liquid firms, they can be magnified for smaller, illiquid firms.
Another big assumption from the academic studies is a “zero-cost” trading assumption, which is really several assumptions rolled into one. Studies assume that when shares are sold short, the proceeds are available to fund the long portfolio. In the real world it doesn’t work like this. In the real world, when shares are sold short, investors need to post collateral (usually equal to ~50% of the value of the short position), although they earn an interest rebate from the lender. The authors find rebates are very important for assessing strategies. Yet rebates are affected by the stocks selected. For instance, shares that are easy to locate for borrowing might have a low rebate fee, while shares that are harder to locate might have a higher rebate fee. Banks also charge fees for taking a short position.
Bid-ask spreads are also an important issue that is often glossed over or ignored in academic papers. Any rebalancing requires selling at the bid price and buying at the ask price, and bid/ask spreads can be wide, depending on market conditions or size/liquidity of stocks traded.
When it Comes to Alpha, Size Matters
Many of the considerations above are affected by the size/liqudity of the stocks traded. Clearly, the creation and maintenance of a short book (and also a long book), becomes more challenging to the extent a portfolio contains small stocks. As discussed above, liquidity considerations include the ability to borrow securities, short recalls, rebate fees, and bid-ask spreads. As it turns out, the anomalies in the literature often assume an easy, more or less frictionless ability to invest in small stocks. And academics assume a lot of small stocks are investable.
The chart below sets forth the percentage of stocks in anomaly deciles with low stock prices:
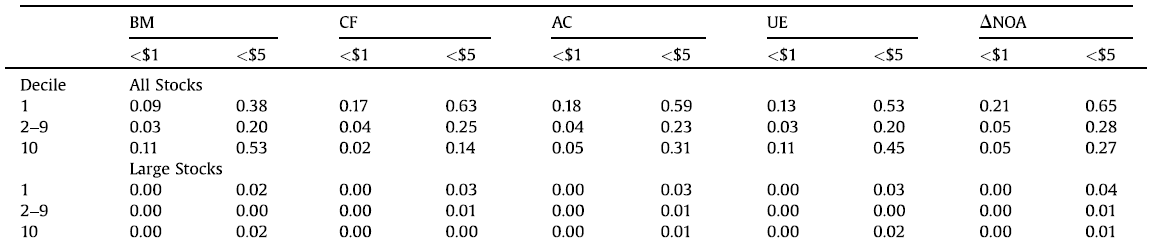
The results are hypothetical results and are NOT an indicator of future results and do NOT represent returns that any investor actually attained. Indexes are unmanaged, do not reflect management or trading fees, and one cannot invest directly in an index. Additional information regarding the construction of these results is available upon request.
Note that, when considering all stocks, significant portions of the anomalies are assumed to be invested in small stocks. The percentage of stocks <$5 in the extreme portfolios (deciles 1 or 10) ranges from 14% to 65%. This has significant implications for anyone interested in pursuing any of these strategies. Within a larger stock universe, this effect is not as pronounced.
Cost of Capital
Because long/short strategies require that funds be provided, there is an opportunity cost of capital associated with running them. What is this cost of capital? How should you think about it?
Under CAPM, if a hedge strategy has a beta of zero, this suggests the risk-free rate is appropriate. Yet clearly in the real world, investors must consider non-market risk. This implies the cost of capital for hedge strategies is something higher than the risk-free rate.
Many have suggested that a higher cost of capital is appropriate in the real world because hedge fund returns are correlated with market returns, and are not offering real “alternative” exposures. For instance, Cliff Asness points out here that “hedge funds are generally net long about 40% of the stock market.”
Perhaps the market return is a useful benchmark. If the expected return for a hedged strategy is higher or lower than for long-only equities, then this may have implications for the cost of capital (and survivability) of a hedge fund.
The cost of the long position may also be relevant (the cost of the long position is calculated by subtracting short position returns from long-only alpha).
The authors use these 3 separate measures for cost of capital to assess strategies:
- Risk-free rate; assumes short portfolio perfectly hedges the long portfolio
- Market return
- Cost of the long position
“Academic” Alphas of the Long-Short Strategies
First, the authors examine the strategies in the usual way. As is the convention in academia, the authors run Fama-French 3-Factor regressions, and report the statistical significance of the alphas:
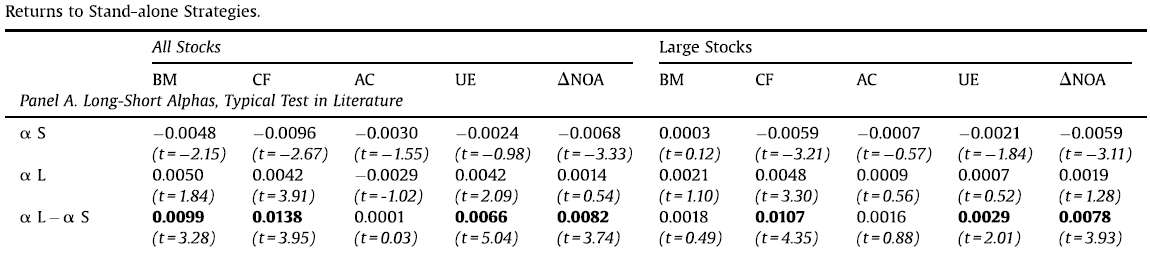
The results are hypothetical results and are NOT an indicator of future results and do NOT represent returns that any investor actually attained. Indexes are unmanaged, do not reflect management or trading fees, and one cannot invest directly in an index. Additional information regarding the construction of these results is available upon request.
Looking good! The hedge alphas look positive and significant for almost all the strategies (except AC).
Should we go ahead and invest?
And Now For a Bucket of Cold Water…
Not so fast. The authors consider the effects of the various costs and considerations discussed earlier. These include financing costs of the short position, the rebate, the alternatives for cost of capital, bid-ask spread considerations, and management fees, all of which would be associated with investing in a hedge fund:
![]()

The results are hypothetical results and are NOT an indicator of future results and do NOT represent returns that any investor actually attained. Indexes are unmanaged, do not reflect management or trading fees, and one cannot invest directly in an index. Additional information regarding the construction of these results is available upon request.
Looking at the first row (“rf no rebate”), remarkably, when the cost of capital is the risk-free rate and without the rebate, no strategy remains significant after costs.
The second row (“rf”) indicates that when rebates are received and the cost of capital is the risk free rate, excess returns are insignificant for many strategies. Again, this assumes the risk-free rate is the cost of capital. What if we assume something higher? Rows three (“mkt”) and four (“Long Cost”) use alternatives to the risk-free rate as the cost of capital. All the alpha from the strategies disappears!
On the next several rows, the authors go back to assuming a risk-free cost of capital, but apply the effects of bid-ask spread, management fee, and both combined. Even assuming the risk-free rate as the cost of capital–which is questionable–once we include the costs of spreads and management fees, again, all the alpha vanishes.
We discussed earlier how the risk-free rate is probably an unrealistically low cost of capital, so what happens if you assume something a bit higher and then you consider spreads and fees? Holy evaporating alpha batman! We don’t even need to see the results. In a slam dunk, the real-world costs of rebates, spreads, management fees and cost of capital seem to eliminate all that academic alpha.
Sharpe Ratios
Yet maybe these strategies are still worth pursuing because of superior risk-adjusted returns, as would be reflected in Sharpe ratios (brace for more cold water).
Below are Sharpe ratios for the strategies discussed above:
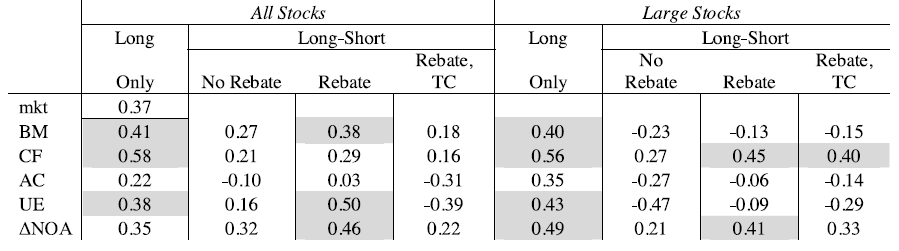
The results are hypothetical results and are NOT an indicator of future results and do NOT represent returns that any investor actually attained. Indexes are unmanaged, do not reflect management or trading fees, and one cannot invest directly in an index. Additional information regarding the construction of these results is available upon request.
The market benchmark Sharpe ratio is 0.37. The strategy Sharpe ratios in excess of the market are shaded above. What do you notice?
The long books look good. Almost all the long-only anomalies offer better risk-adjusted returns than the market.
But look at what that pesky short book does to performance. Again, the rebate is important. But while the rebate helps a lot, once you consider rebates and transaction costs, on a risk-adjusted basis, the long-short returns don’t look very impressive at all. Of course, one can argue that these L/S systems have portfolio diversification benefits, so perhaps a Sharpe ratio doesn’t capture the true risk/reward, however, while this might be true, the figures aren’t promising. And if you are an investor in a hedge fund seeking to exploit these academic anomalies, you should probably be depressed by now.
Combinations of Strategies
Although this paper is pretty relentlessly pessimistic as far as the impact of all these costs on long-short strategies in general, the lone bright spot is some interesting results obtained through combining strategies, both with each other and the market in long-short and long-only formats. We’ll leave it to inquisitive readers to comb through the paper for details and/or seek others for council (e.g., Larry Swedroe has a recent post on the benefit of diversifying factors).
The main takeaway is that the benefits of long-short investing derive primarily from their use as diversifiers to strategies that include market exposures, due to low correlations between the strategies and the market.
Summary
While academic studies offer the tantalizing prospect of superior long-short and long-only performance, the devil is in the details. If we relax academic “zero-cost” assumptions, and account for market cap/liquidity considerations, rebates, transaction costs, bid-ask spreads, cost of capital, and management fees, all of which occur in the real world, the benefits are not as great as they may appear from looking at an academic paper.
The costs and benefits of long-short investing: A perspective on the market efficiency literature
Beaver, McNichols, and Price
A version of the paper can be found here.
Want a summary of academic papers with alpha? Check out our Academic Research Recap Category.
Abstract:
We highlight key assumptions implicit in the models used by academics conducting research on market efficiency. Most notably, many academics assume that investors can borrow unlimited amounts and construct long-short portfolios at zero cost. We relax these assumptions and examine the attractiveness of long-short strategies as stand-alone investments and as a part of a diversified portfolio. Our analysis illustrates that the key benefit of long-short investing is adding diversification to a portfolio beyond what the market provides. We show that as stand-alone investments, nontrivial risk remains in the “hedge” strategies and that the returns generally do not beat the market in a head-to-head contest. Our findings raise questions about the degree of inefficiency in anomaly studies because plausible measures of costs generally offset strategy returns. The ability to achieve greater diversification may be, but is not necessarily, due to market inefficiency. We also highlight the key role of the generally ignored but critically important short interest rebate and show that absent this rebate, the long-short strategies we examine generally yield insignificant returns.
About the Author: Wesley Gray, PhD
—
Important Disclosures
For informational and educational purposes only and should not be construed as specific investment, accounting, legal, or tax advice. Certain information is deemed to be reliable, but its accuracy and completeness cannot be guaranteed. Third party information may become outdated or otherwise superseded without notice. Neither the Securities and Exchange Commission (SEC) nor any other federal or state agency has approved, determined the accuracy, or confirmed the adequacy of this article.
The views and opinions expressed herein are those of the author and do not necessarily reflect the views of Alpha Architect, its affiliates or its employees. Our full disclosures are available here. Definitions of common statistics used in our analysis are available here (towards the bottom).
Join thousands of other readers and subscribe to our blog.