- Title: OVERREACTION AND THE CROSS-SECTION OF RETURNS: INTERNATIONAL EVIDENCE
- Authors: Douglas W. Blackburn, Nusret Cakici
- Publication: Journal of Empirical Finance 42 (2017) 1-14 https://ssrn.com/abstract=2800188
What are the research questions?
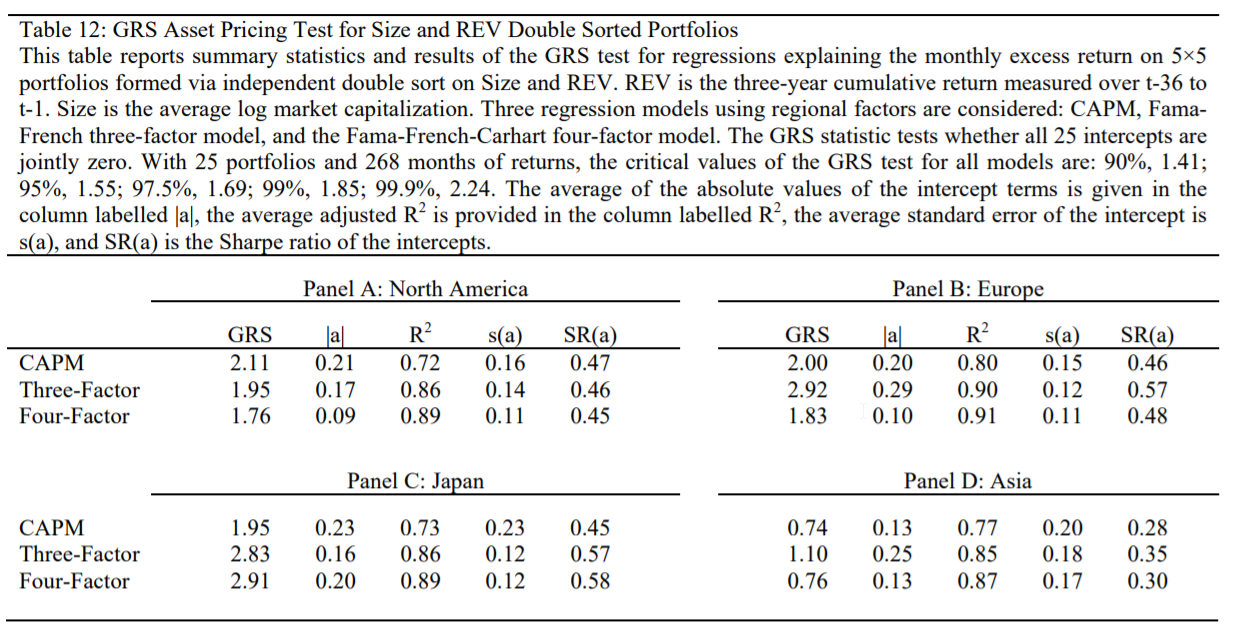
- Is there a consistent and reliable long term overreaction pattern in global equity markets? In US equity markets, buying long term losers and selling long term winners (also called long term price reversal) is a well-documented anomaly. Does it also exist in global equity markets?
- Do known risk characteristics explain all or part of the excess returns associated with the reversal pattern in global markets?
- Does the long term price reversal effect coexist with the short term momentum factor in global equities? Again, in US equity markets, this anomalous return performance is well documented.
What are the Academic Insights?
- YES. Twenty-three developed countries sorted into four regions including North America, Europe, Japan and Asia exhibited a significant price reversal effect for the period 1993-2014. The long/short (winner minus loser) spreads were significant at -.80% for North America; -.54% for Asia and -1.03% for Japan. The spreads for European stocks were not significant at +.28%. ONE MAJOR CAVEAT: the results reported show that reversals are isolated to stocks in the bottom 10% of market capitalization. It is possible that this abnormal performance in all other quintiles has been arbitraged.
- NO. Risk-adjusted returns on the same portfolios relative to Fama-French four factor regressions remained significant for North America at -.84%, for Asian at -.91% and -.75% for Japan. Excess returns for Europe on long term reversals were again not significant at +.05%.
- YES. Double sorting on and within short term momentum and long- term reversals works for all four regions. The largest spreads for long term reversal are found within the set of stocks found in the worst twelve-month price momentum quintile. Average absolute return spreads were significant for North America at -1.88%; for Europe at -1.18%; for Japan at -2.00%; and -1.76% for Asia. The large spreads were also found across all reversal quintiles for the long/short momentum portfolios, with the largest being the highest price reversal quintile.
Why does it matter?
First, this study is the first to fill the void in the empirical literature on the global nature of price reversals. While there is ample evidence with respect to short term price momentum in the global arena, there is little to no evidence on the predictability of longer term price reversals.
Second, issues of datamining (aka “torturing the data” or “datasnooping”) are pervasive in this type of research. A notable strength of this study is the use of a methodology that mitigates this particular criticism. The sample universe is truly out of sample in terms of the time period examined and in terms of the four geographical regions.
Third, the similarity of the results across geographical markets that differ in terms of trading practices, taxation, and trading costs is convincing and supports a robust effect.
All three factors considered, the results described in the study should be considered to be powerful, pervasive and reliable.
What is the most important chart from the paper?
About the Author: Tommi Johnsen, PhD
—
Important Disclosures
For informational and educational purposes only and should not be construed as specific investment, accounting, legal, or tax advice. Certain information is deemed to be reliable, but its accuracy and completeness cannot be guaranteed. Third party information may become outdated or otherwise superseded without notice. Neither the Securities and Exchange Commission (SEC) nor any other federal or state agency has approved, determined the accuracy, or confirmed the adequacy of this article.
The views and opinions expressed herein are those of the author and do not necessarily reflect the views of Alpha Architect, its affiliates or its employees. Our full disclosures are available here. Definitions of common statistics used in our analysis are available here (towards the bottom).
Join thousands of other readers and subscribe to our blog.


