The folks at AQR are top-notch researchers and have written a ton of great papers.
Some of their more famous papers are the following:
- Value and Momentum Everywhere
- A Century of Evidence on Trend Following
- Size Matters If you Control Your Junk (my favorite title of any paper ever published)
In this post, I wanted to highlight a number of lesser known papers by the fine folks at AQR that deal with the volatility premium primarily through covered call selling. Specifically, the papers help us understand 1) how covered call selling relates to the volatility premium, 2) how to harvest the volatility premium, 3) how to create a volatility premium factor and understand if other strategies or investments actually capture the volatility premium.
I am going to assume some working knowledge of options and option pricing for the remainder of this post.
Volatility Premium
The first step in understanding covered calls (or cash secured put selling, which are economically equivalent) is to understand the volatility premium.
The volatility premium is the historical tendency for the implied volatility of an option to be greater than the realized volatility of the underlying security. Since the implied volatility of the option is greater than realized volatility (historically and on average) then an investor who sells an option (volatility) should expect to make a profit (on a delta hedged basis) as they are selling a dollar bill for more than a dollar.
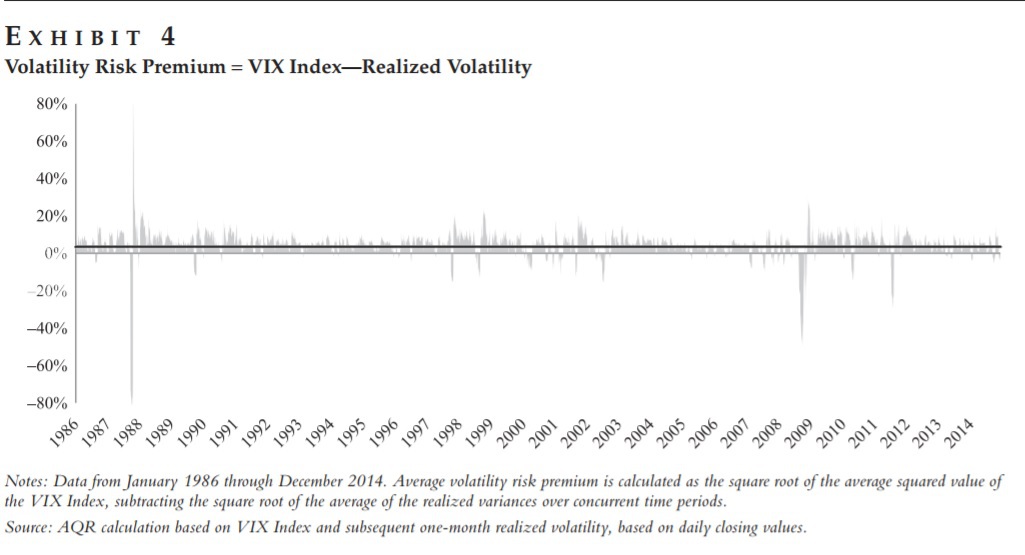
This concept is driven home by a great Exhibit 4 in Embracing Downside Risk (another good paper by the folks at AQR). Exhibit 4 in the paper is shown below:
The results are hypothetical results and are NOT an indicator of future results and do NOT represent returns that any investor actually attained. Indexes are unmanaged, do not reflect management or trading fees, and one cannot invest directly in an index. Additional information regarding the construction of these results is available upon request.
What Exhibit 4 shows is that for the S&P 500 from 1986 through 2014 the implied volatility (VIX) has been greater than realized volatility the majority of time…but not always (there are spikes in the graph that are below the 0% line which means realized volatility was greater than implied volatility).
The key takeaway from the Embracing Downside Risk paper is that one can potentially improve investment returns by effectively harvesting the volatility premium in their portfolio.
Covered Calls Uncovered
The folks at AQR wrote another great paper on covered calls and the volatility premium called Covered Calls Uncovered. I learned a lot from this paper, and one of the biggest takeaways from me are that covered calls are actually a bundle of 3 return streams:
- Beta of 0.5 to the underlying asset (in this paper it is the S&P 500) called Passive Equity by the authors.
- At-the-money short straddle called Short Volatility by the authors.
- Timing bet on the underlying asset called Equity Timing by the authors.
The component pieces can be easily visualized by Figure 1 in the paper, below.

The results are hypothetical results and are NOT an indicator of future results and do NOT represent returns that any investor actually attained. Indexes are unmanaged, do not reflect management or trading fees, and one cannot invest directly in an index. Additional information regarding the construction of these results is available upon request.
Equity Timing in Covered Calls?!
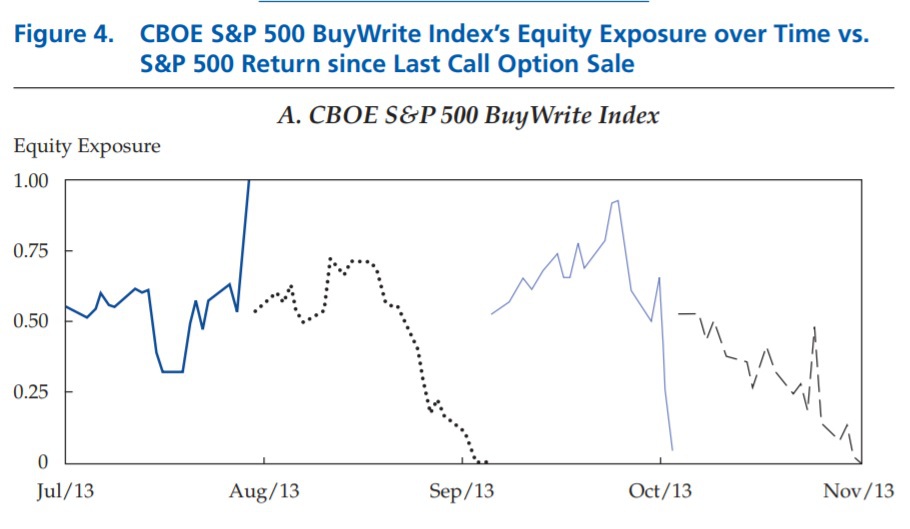
The CBOE BuyWrite Index each month sells a call option that is closest to the current price of the S&P 500. This means that when the option is sold, the delta (i.e. beta to the S&P 500) is approximately 0.5. As the price of the S&P 500 moves around between when the option is sold and the expiration of the option, it will have a different delta (beta to the S&P 500). Finally, as the maturity of the option approaches, the delta of the option starts to become more binary as it either moves to 0.0 (option expires out of the money) or 1.0 (option expires in the money).
The authors show this phenomenon in Figure 4 in the paper, below:
The results are hypothetical results and are NOT an indicator of future results and do NOT represent returns that any investor actually attained. Indexes are unmanaged, do not reflect management or trading fees, and one cannot invest directly in an index. Additional information regarding the construction of these results is available upon request.
Figure 4, above, shows the delta of the option sold as part of the CBOE BuyWrite Index over a 3 month period of time in 2013.
- The first line shows the option being sold in July 2013 at a delta of approximately 0.5 and then as the S&P 500 appreciated the option eventually had a delta of 1.0.
- The second line shows the next option being sold in August 2013 (after the expiration of the July 2013 option) at a delta of approximately 0.5. The S&P 500 didn’t go up in price during the lifetime of this option, so the delta eventually drops from 0.5 to 0.0.
Figure 4, above, also shows that the average delta (beta to the S&P 500) over the whole time period is somewhere around 0.5 but that it varies quite a bit…this movement around the 0.5 delta over time IS the Equity Timing bet that the authors describe. This provides extra volatility (when compared to a constant 0.5 beta to the S&P 500) and no meaningful return (see below).
Summary Stats for Components of Covered Calls
This paper also decomposes the return series for all 3 sources, above, and shows the return and risk for each one in Table 1 in the paper, below:

The results are hypothetical results and are NOT an indicator of future results and do NOT represent returns that any investor actually attained. Indexes are unmanaged, do not reflect management or trading fees, and one cannot invest directly in an index. Additional information regarding the construction of these results is available upon request.
As one can see from the table, above, the Passive Equity and Short Volatility return streams offer a meaningful return (especially when compared to their volatility) while the Equity Timing timing bet offers no meaningful return (nor should it when viewed from the perspective of a risk premium).
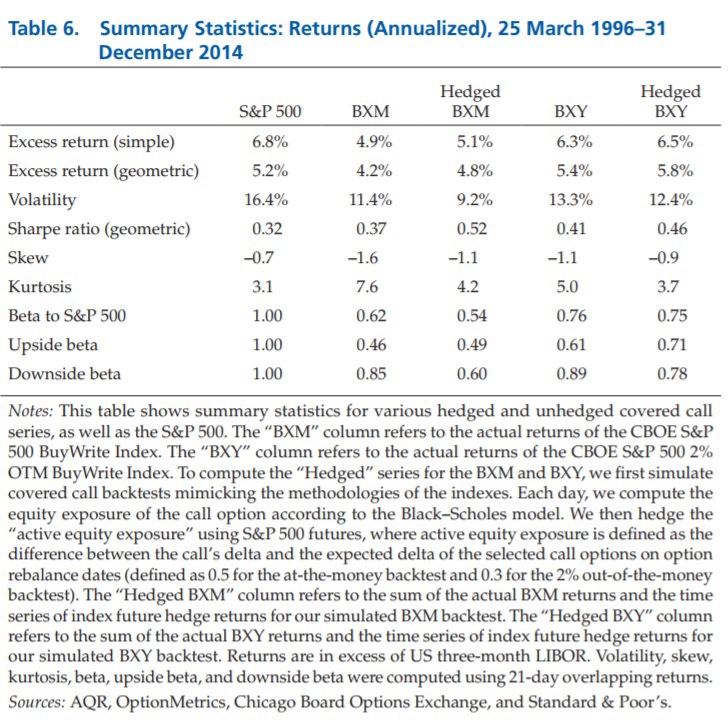
Covered Calls Uncovered goes a step further and shows that one can cancel out the unwanted Equity Timing return stream (it doesn’t offer a return but contributes a fair amount of volatility) and be left with two return streams that an investor should/may want (Passive Equity and Short Volatility). Table 6, below, shows the results for an at-the-money covered call writing strategy with the Equity Timing return stream hedged. The authors call this Hedged BXM.
The results are hypothetical results and are NOT an indicator of future results and do NOT represent returns that any investor actually attained. Indexes are unmanaged, do not reflect management or trading fees, and one cannot invest directly in an index. Additional information regarding the construction of these results is available upon request.
The results table, above, show that by hedging, or canceling the Equity Timing bet, the return of covered call writing is 1) improved, 2) the volatility is decreased, and 3) the Sharpe ratio is meaningfully improved (compare BXM to Hedged BXM in the table, above).
Creating a Volatility Premium Factor
Covered Calls Uncovered has given us the framework for isolating and measuring the volatility premium which allows us to create a Volatility Premium factor. To create a Volatility Premium factor, I use an equal weighted and monthly rebalanced portfolio of the CBOE S&P 500 BuyWrite Index and the CBOE S&P 500 PutWrite Index.
It is important to use a combination of both of these indices to measure the volatility premium because the two indices have different historical returns (CBOE S&P 500 PutWrite Index being greater) which flies in the face of put-call parity. I make the assumption that the “true” return for measuring the volatility premium is the average return of the two indices.
Not surprisingly, AQR has another paper that addresses the return difference between the two indices called PutWrite versus BuyWrite: Yes Put-Call Parity Holds Here Too. The paper explains that the difference in returns of the two indices comes down to the S&P 500 return during a 4 hour window per month where one index has its option positions settled and the other index still has their option position open.
Using the average return of the two CBOE indices, I subtract the return of cash and half the return of the MKT factor (to cancel the Passive Equity component). This has the effect of isolating the return of Shorting Volatility (aka the Volatility Premium). This does not cancel out the Equity Timing bet, but without more extensive data I can’t find a way to also remove the Equity Timing bet.
We can use this new return series to run regressions on fund return histories to measure the extent they harvest the Volatility Premium!
Volatility Premium Regressions
Now that we have the Volatility Premium factor return series, we can use it to test if indices or funds actually are able to harvest the Volatility Premium.
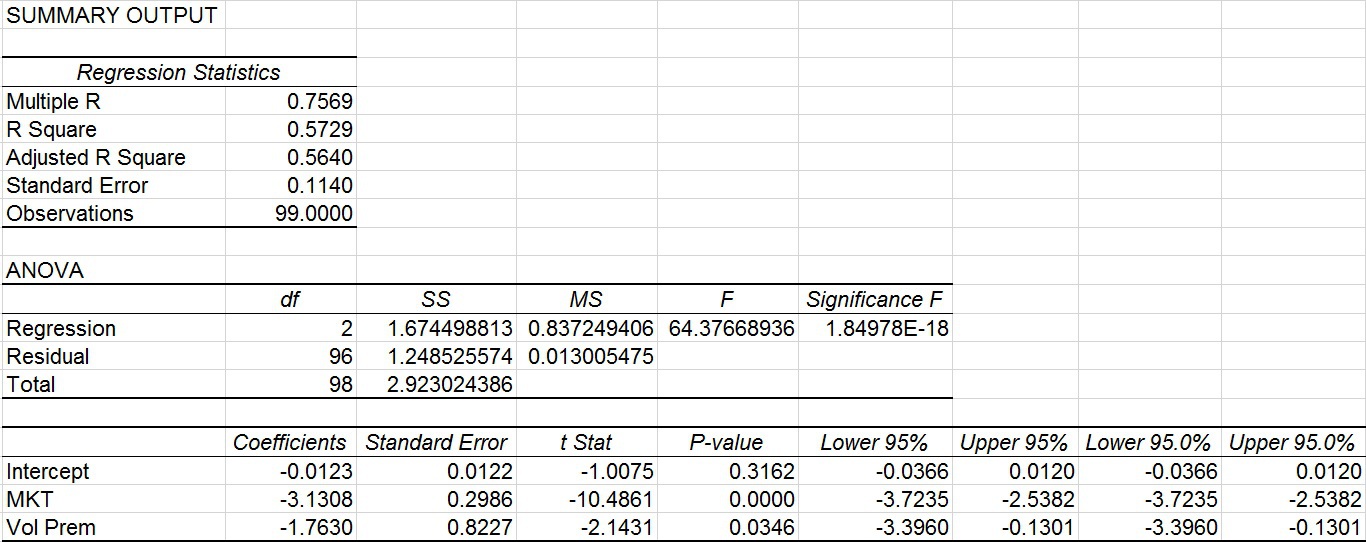
I thought it would be insightful to run a regression analysis on two ETFs 1) iPath S&P 500 VIX ST Futures ETN (VXX) and 2) Velocity Shares Daily Inverse VIX ST ETN (XIV) since inception as well as the index that the two products as derived from – S&P VIX Short-Term Futures TR.
iPath S&P 500 VIX ST Futures ETN (VXX)
The results are hypothetical results and are NOT an indicator of future results and do NOT represent returns that any investor actually attained. Indexes are unmanaged, do not reflect management or trading fees, and one cannot invest directly in an index. Additional information regarding the construction of these results is available upon request.
What we can see from this regression is that VXX doesn’t have a statistically significant alpha (although negative, it isn’t statistically significant). We also see that VXX has historically been effectively 3 times short the MKT factor (at a very statistically significant T-stat of 10.4) which is what one would expect for VXX as it is long VIX futures. In addition, VXX is effectively 1.76 times short the Volatility Premium (at a statistically significant 2.1 T-stat). This is also expected as VXX pays the volatility premium by making a bet that realized volatility will be greater than the volatility implied in the VIX future contract.
S&P VIX Short-Term Futures Index
Is the regression results for the investable product different from the index it is based on? To answer that questions, I run the regression analysis on the index history, below. The index has a longer history than that of VXX so the regression results will be different due to the different time period (VXX history starts in 2010 whereas the history for the index starts 7/1/2007).
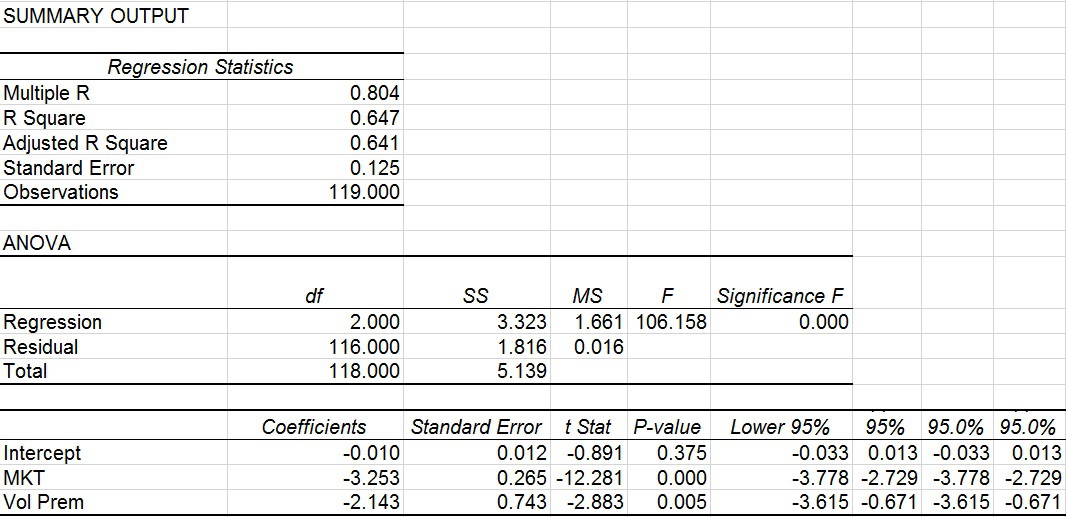
The results are hypothetical results and are NOT an indicator of future results and do NOT represent returns that any investor actually attained. Indexes are unmanaged, do not reflect management or trading fees, and one cannot invest directly in an index. Additional information regarding the construction of these results is available upon request.
As you can see from the regression of the S&P VIX Short-Term Futures TR index, the results are largely consistent with that of VXX in that there is no statistically significant intercept (alpha), it has a negative beta of approximately 3 to the MKT factor and it has a negative beta of approximately 2 to the Volatility Premium factor.
VelocityShares Daily Inverse VIX ST ETN (XIV)
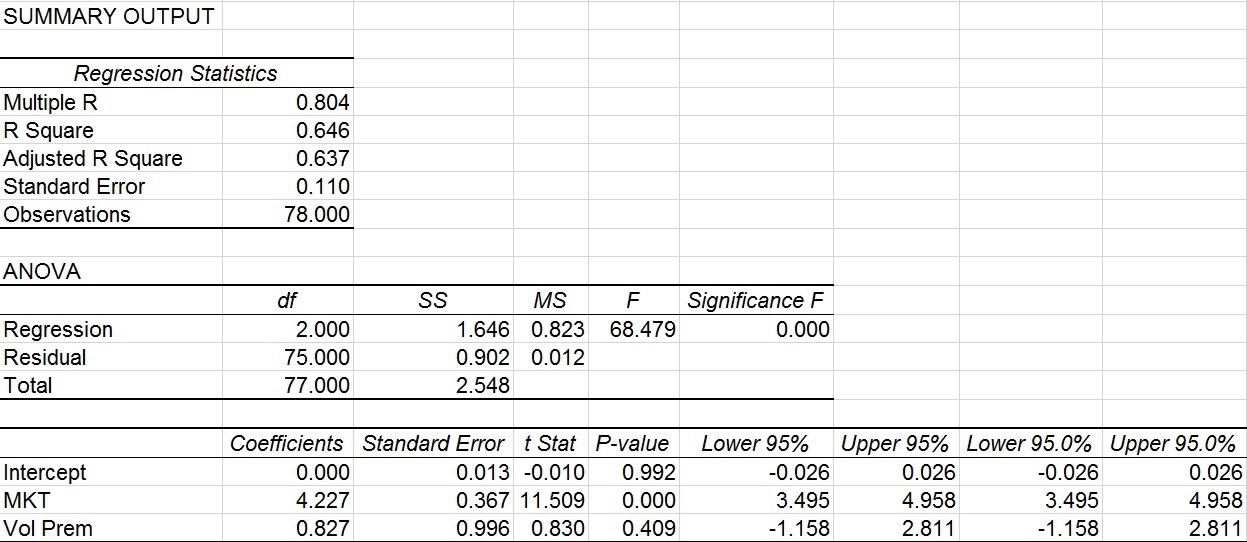
The results are hypothetical results and are NOT an indicator of future results and do NOT represent returns that any investor actually attained. Indexes are unmanaged, do not reflect management or trading fees, and one cannot invest directly in an index. Additional information regarding the construction of these results is available upon request.
The regression results show that XIV has no statistically significant alpha (and it is 0% down to the third decimal). In addition XIV has a beta of 4.2 to the MKT factor which is extremely statistically significant with a T-stat of 11.5.
The result I find the most fascinating is that XIV has no statistically significant beta to the Volatility Premium! This means that although XIV generates an inverse daily return to the Short-Term VIX Futures Index, it doesn’t actually harvest the Volatility Premium (which one would expect if it were the inverse of VXX or the inverse of the S&P Short-Term Futures Index).
The next natural questions is – Why doesn’t XIV have a statically significantly positive factor loading to the Volatility Premium (as it should be the daily inverse of VXX and therefore the factor loadings should be similar but with opposite signs)?
One can’t answer that question definitively, but my guess is that it is due to the volatility drag of the daily inverse mechanism. The volatility drag could effectively negative any benefit XIV would derive from being long the Volatility Premium.
Conclusions
I want to conclude with a couple of thoughts about implications and applications of this post:
- I don’t make any recommendations about any of the securities or indices highlighted here, but I want to draw attention to the various investment alternatives where the Volatility Premium might appear.
- I also want to highlight that despite the name of an investment product or index might be, it may not actually capture the academic return stream that its name might imply. (see here for another example).
- I wanted to provide some framework and instructions for creating your own Volatility Premium factor so that you can use this in determining if an investment you are analyzing is actually capturing this premium, if it has no meaningful exposure to the Volatility Premium or even if it is short the Volatility Premium.
About the Author: Andrew Miller
—
Important Disclosures
For informational and educational purposes only and should not be construed as specific investment, accounting, legal, or tax advice. Certain information is deemed to be reliable, but its accuracy and completeness cannot be guaranteed. Third party information may become outdated or otherwise superseded without notice. Neither the Securities and Exchange Commission (SEC) nor any other federal or state agency has approved, determined the accuracy, or confirmed the adequacy of this article.
The views and opinions expressed herein are those of the author and do not necessarily reflect the views of Alpha Architect, its affiliates or its employees. Our full disclosures are available here. Definitions of common statistics used in our analysis are available here (towards the bottom).
Join thousands of other readers and subscribe to our blog.

