The Long-Run Drivers of Stock Returns: Total Payouts and the Real Economy
- Philip U. Straehl and Roger G. Ibbotson
- Financial Analysts Journal
- A version of this paper can be found here
- Want to read our summaries of academic finance papers? Check out our Academic Research Insight category
What are the research questions?
- Given the prevalence of buybacks as a form of corporate payouts, should they be explicitly included in supply-side models such as the dividend discount model (DDM) used to forecast of stock returns?
- Does the same superior performance extend to the prediction of short-term changes in expected returns?
What are the Academic Insights?
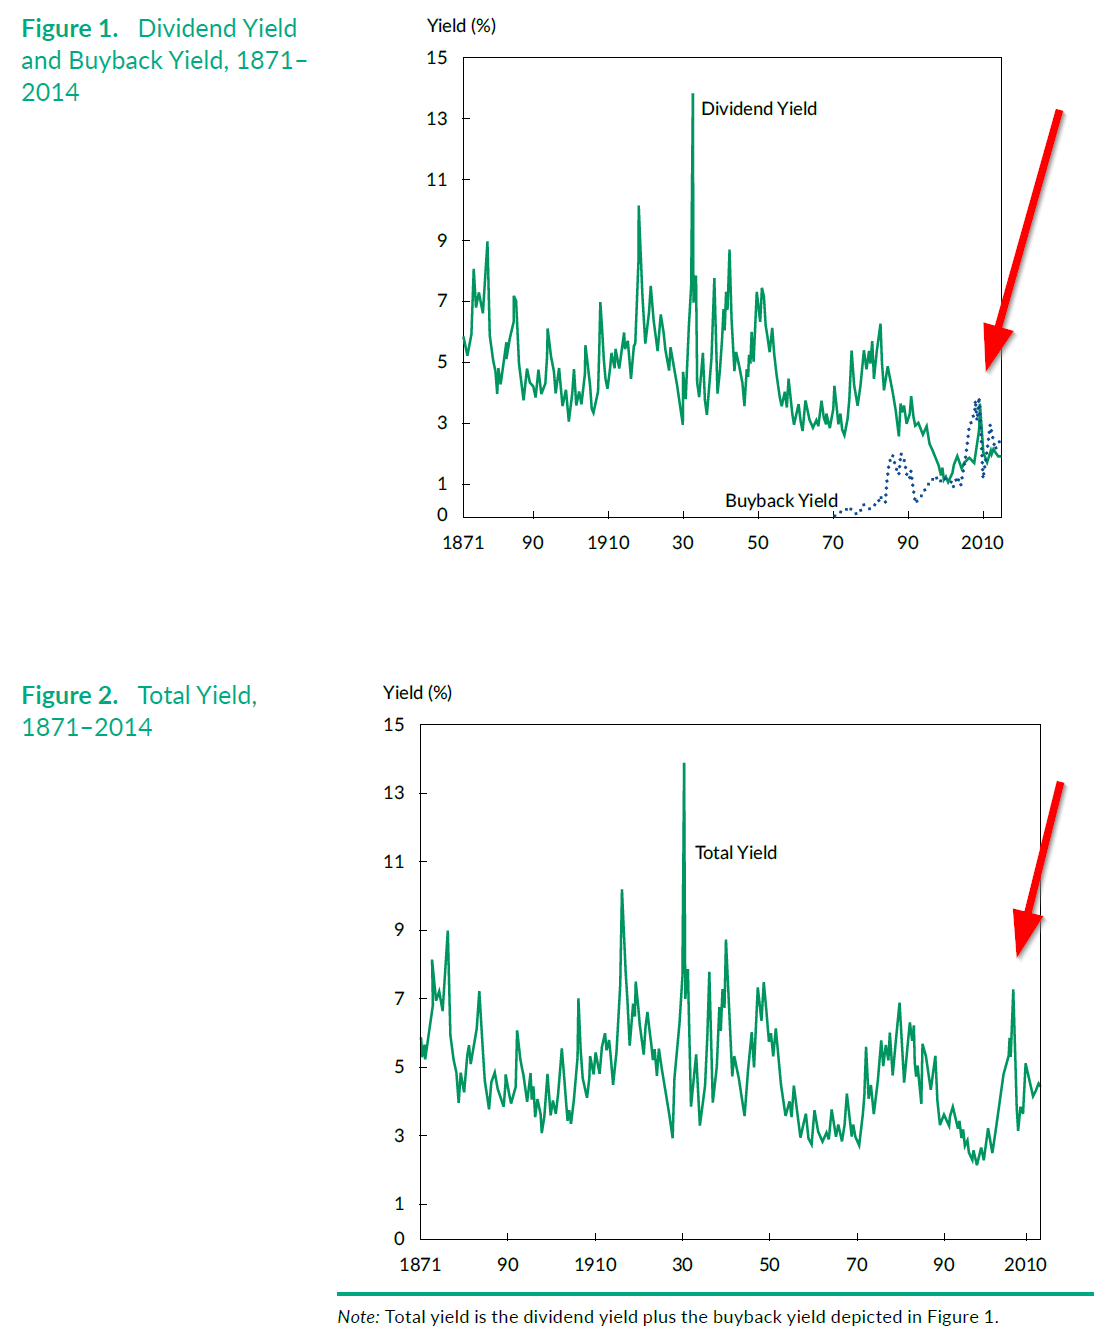
- YES. Dividends, as a payout measure, affect the income component of returns, while buybacks affect the price per share component. If a historical time series of dividend payouts is used as a proxy for growth, an underestimate of the forward-looking return will occur if the series includes periods of significant buyback activity. The authors construct two new models (dividend + cash buybacks; and dividend + net issuances) of total payouts that are independent of the payout policies of corporations and compare them to the growth rate of the real economy. Results show that total payouts are a more stable proxy for corporate payouts than dividends. Inconsistent with previous research, this study provides evidence that long-run growth in total payouts can be estimated from the long run growth in the real economy. Over the period 1901-2014, aggregate total payouts per share grew at 3.27% and GDP grew at 3.36% with a t-statistic of 0.75, testing for differences. Over the period 1872-2014, total payouts per share grew at 1.67% and growth in GDP per capita was 1.83%, with a t-statistic of .61.
- YES. In regressions performed over the most recent sample period, 1970–2014, buyback adjusted measures performed equally as well or outperformed traditional models utilizing dividend yields only.
Why does it matter?
This study is interesting because it pinpoints a period of time in which a structural break in the return components of the time series of returns used by traditional supply-side models of return forecasting occurred. In the early 80s, buybacks were gradually substituted for dividends until they actually surpassed the total dividends in the most recent ten year period. This apparent change in corporate payout policy also coincided with the adoption of SEC Rule 10b-18 providing a safe harbor for firms conducting share buybacks, in 1982. Traditional supply type models such as the DDM, as applied by practitioners have generally fail to incorporate this structural shift. The resulting underestimates of future long and short-term stock returns occur when current and historical market returns are combined in the DDM, and data is unadjusted for the impact of buybacks on shares.
The most important chart from the paper
The results are hypothetical results and are NOT an indicator of future results and do NOT represent returns that any investor actually attained. Indexes are unmanaged, do not reflect management or trading fees, and one cannot invest directly in an index.
Abstract
We provide theoretical and empirical evidence over 1871–2014 that total payouts (dividends plus buybacks) are the key drivers of long-run stock market returns. We show that total payouts per share (adjusted for the share decrease from buybacks) grew in line with economic productivity, whereas aggregate total payouts grew in line with GDP. We also show that a dividend discount model (DDM) based on current yields and historical growth rates underestimates expected returns relative to the total payout model. Finally, we demonstrate that the cyclically adjusted total yield (CATY) predicts changes in expected returns at least as well as the cyclically adjusted price-to-earnings ratio (CAPE).
About the Author: Tommi Johnsen, PhD
—
Important Disclosures
For informational and educational purposes only and should not be construed as specific investment, accounting, legal, or tax advice. Certain information is deemed to be reliable, but its accuracy and completeness cannot be guaranteed. Third party information may become outdated or otherwise superseded without notice. Neither the Securities and Exchange Commission (SEC) nor any other federal or state agency has approved, determined the accuracy, or confirmed the adequacy of this article.
The views and opinions expressed herein are those of the author and do not necessarily reflect the views of Alpha Architect, its affiliates or its employees. Our full disclosures are available here. Definitions of common statistics used in our analysis are available here (towards the bottom).
Join thousands of other readers and subscribe to our blog.


