Technical Analysis Profitability Without Data Snooping Bias: Evidence from Chinese Stock Market
- Fuwei Jiang, Guoshi Tong and Guokai Song
- International Review of Finance
- A version of this paper can be found here
- Want to read our summaries of academic finance papers? Check out our Academic Research Insight category
What are the research questions?
The authors conduct a comprehensive analysis of five categories of technical trading rules (including channel break rules, filter rules, moving average rules, oscillator rules and support/resistance rules) using aggregate data from the Chinese stock market for the period 1997 to 2015.
- Do technical trading rules “work” in the Chinese stock market after mitigating the impact of data mining biases?
- If profitable trading rules do exist, are they explained away by transactions costs?
What are the Academic Insights?
- YES. Out of a total of 28,000+ rules, the authors identify 170 market timing rules and 54 rules with higher Sharpe ratios when compared to a buy and hold strategy and controlling for data snooping. A large number of trading rules tested within one data set increases the likelihood of incorrectly making a Type I (rejecting the null hypothesis) error, therefore the authors use a “stepwise superior predictive ability test” [extended from White (2000); Romano and Wolf (2005); Hansen (2005); Hsu et al. (2010)], and designed to identify profitable trading rules from a large number of possibilities while controlling for data mining biases. The rules identified as profitable represent less than 1% of the sample when the data snooping test is applied. As a point of comparison, using a simple t-test to identify profitable rules generates a massive number, in the 23,000+ range. Obviously, without a correction for data snooping bias, the vast majority of trades considered only appear to be profitable in the Chinese market and that number should be considered grossly inflated.
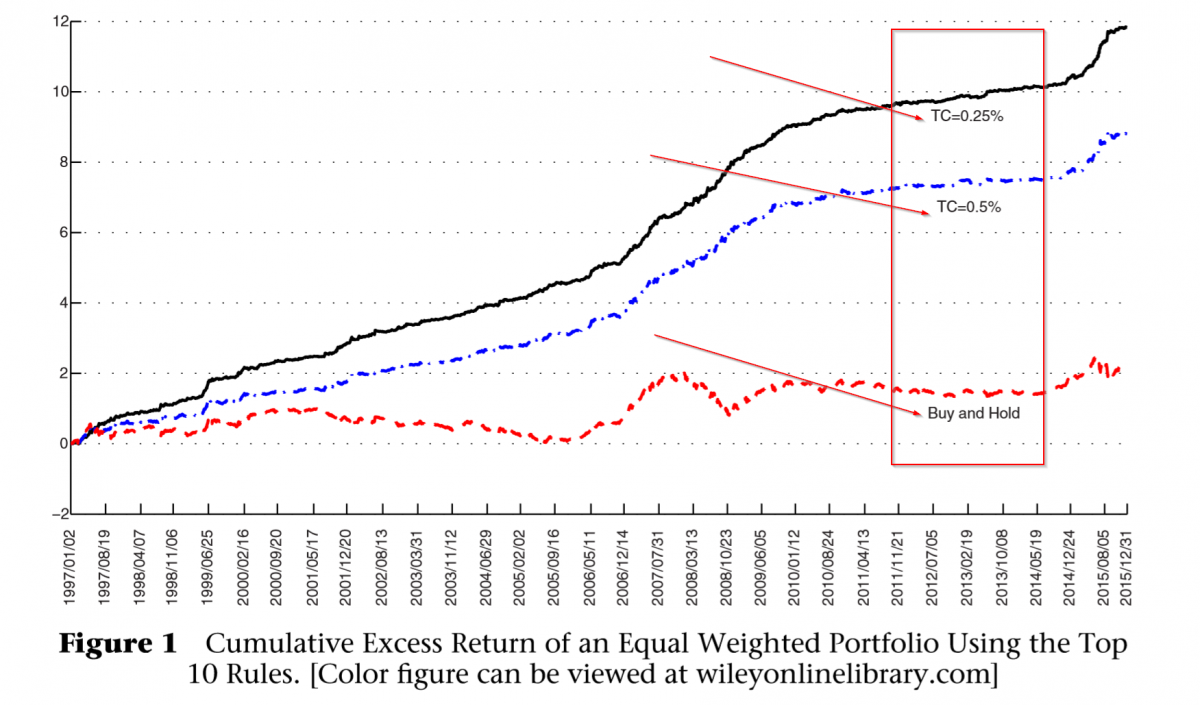
- YES. When transactions costs of .25% (.50%) one-way, are considered, the numbers decline to 144 (142) rules identified from 170; and no change from the 54 with gains in the Sharpe ratio. The moving average category dominated the significant results. When the best 10 rules were applied, they produced an annualized excess return of 65% with a Sharpe ratio of 2.6 when transactions costs were applied at .25%. When transactions costs were raised to .50% the top 10 produced an annualized excess return of 48%, with a Sharpe ratio of 1.8.
Why does it matter?
While the evidence presented in this paper suggests that technical trading rules appear to be profitable, only a scant few are significant when data mining biases are eliminated. However, those few strategies do appear to offer economically significant excess returns. Further, the research presented suggests that the best 10 rules remain economically interesting after transactions costs are considered and when various subperiods are examined.
The most important chart from the paper
Abstract
We perform a comprehensive analysis on the profitability of a large number of technical analysis based trading rules in Chinese stock market. To counter data snooping bias, we employ a stepwise superior predictive ability test to identify genuinely profitable trading rules among more than 28,000 technical signals. Using 19 years of daily data on Chinese aggregate stock market return, we find substantial evidence on the profitability of technical trading rules measured by either the market timing ability or Sharpe ratio gain. Our results on the profitability of technical rules hold during different subperiods and remain valid under the presence of transaction costs.
About the Author: Tommi Johnsen, PhD
—
Important Disclosures
For informational and educational purposes only and should not be construed as specific investment, accounting, legal, or tax advice. Certain information is deemed to be reliable, but its accuracy and completeness cannot be guaranteed. Third party information may become outdated or otherwise superseded without notice. Neither the Securities and Exchange Commission (SEC) nor any other federal or state agency has approved, determined the accuracy, or confirmed the adequacy of this article.
The views and opinions expressed herein are those of the author and do not necessarily reflect the views of Alpha Architect, its affiliates or its employees. Our full disclosures are available here. Definitions of common statistics used in our analysis are available here (towards the bottom).
Join thousands of other readers and subscribe to our blog.


