Fama–French in China: Size and Value Factors in Chinese Stock Returns
- Grace Xing Hu, Can Chen, Yuan Shao, and Jiang Wang
- International Review of Finance
- A version of this paper can be found here
- Want to read our summaries of academic finance papers? Check out our Academic Research Insight category
What are the research questions?
- Does the Fama-French “size” factor explain the cross-section of stock returns in the Chinese A-share market?
- Does the Fama-French “value” factor explain the cross-section of stock returns in the Chinese A-share market?
What are the Academic Insights?
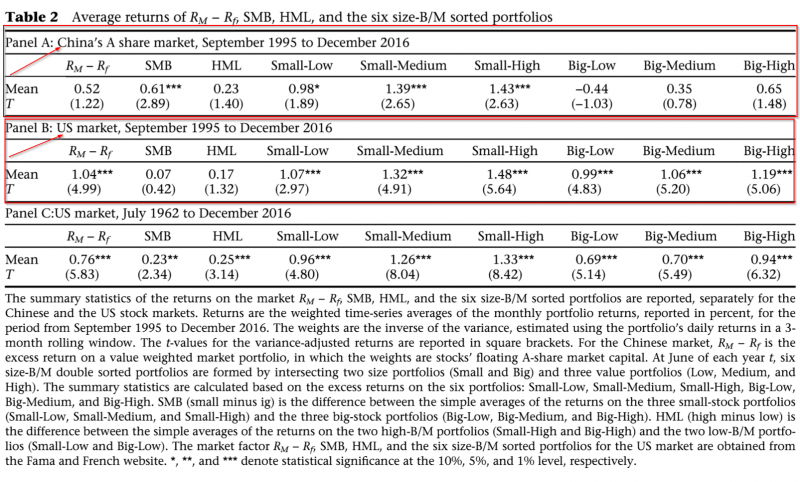
- YES. The authors report a strong negative relationship between the size factor and returns. Out of 10 portfolios of Chinese stocks sorted on size, the smallest size decile returned 1.84% monthly compared to 0.10% for the largest size decile, on average. The long/short return was 1.23% on an average monthly basis, significant at 1%. The returns were not explained by market risk and the relationship between beta and returns was flat. Using the Fama-French 1993 methodology, the SMB spread was 0.61% monthly, 7.32% annually with a t-stat of 2.89.
- NO. The authors report no relationship between 10 portfolios sorted on book-to-market and returns. The long/short return between high vs low B/M was 0.38% monthly with a t-stat of 1.51. Using the Fama-French methodology, HML was 0.23% with a t-stat of 1.40. In addition, the market (RM-Rf) factor returned 0.52% monthly with a t-stat of 1.22. Tests of competing formulations using varying accounting variables for the factors did not contradict the results, nor did tests of different subsamples and various weighting schemes.
Why does it matter?
This study uses an improved approach to the empirical methodology applied to set of data spanning July 1995 to December 2016, for the Chinese A-share equity market, obtained from the Chinese Capital Market Database. It covers historical accounting and returns data for A-share stocks listed on the SSE and SZSE exchanges. A-shares are RMB-denominated and open mostly to domestic investors. However, the results presented are inconsistent with other studies that document strong size and value effects. The discrepancies are likely due to the difficulty in conducting cross-sectional regressions for this market and in particular the small samples tested as well as the very large changes in volatility over the periods studied. The authors attempt to mitigate those biases with improved methodology and speculate that the impact of value and market factors dissipate with a longer time frame and volatility adjustments. Although the various asset pricing tests conducted produce consistent results within the study, this and all research on this overall question should be interpreted with caution and not definitive at this point.
The most important chart from the paper

Abstract
We investigate the size and value factors in the cross-section of returns for the Chinese stock market. We find a significant size effect but no robust value effect. A zero-cost small-minus-big (SMB) portfolio earns an average premium of 0.61% per month, which is statistically significant with a t-value of 2.89 and economically important. In contrast, neither the market portfolio nor the zero-cost high-minus-low (HML) portfolio has average premiums that are statistically different from zero. In both time-series regressions and Fama–MacBeth cross-sectional tests, SMB represents the strongest factor in explaining the cross-section of Chinese stock returns. Our results contradict several existing studies which document a value effect. We show that this difference comes from the extreme values in a few months in the early years of the market with a small number of stocks and high volatility. Their impact becomes insignificant with a longer sample and proper volatility adjustment.
About the Author: Tommi Johnsen, PhD
—
Important Disclosures
For informational and educational purposes only and should not be construed as specific investment, accounting, legal, or tax advice. Certain information is deemed to be reliable, but its accuracy and completeness cannot be guaranteed. Third party information may become outdated or otherwise superseded without notice. Neither the Securities and Exchange Commission (SEC) nor any other federal or state agency has approved, determined the accuracy, or confirmed the adequacy of this article.
The views and opinions expressed herein are those of the author and do not necessarily reflect the views of Alpha Architect, its affiliates or its employees. Our full disclosures are available here. Definitions of common statistics used in our analysis are available here (towards the bottom).
Join thousands of other readers and subscribe to our blog.

