The superior performance of low-beta and low-volatility stocks was documented in the literature back in the 1970s — by Fischer Black (in 1972) among others — even before the size and value premiums were “discovered.” The low-beta/low-volatility anomaly has been demonstrated to exist in equity markets around the globe. I’ve already written about the low-volatility (i.e., low-risk or low-beta) anomaly before (see here and here for some examples).
Idiosyncratic Volatility and the Beta Anomaly
Jianan Liu, Robert F. Stambaugh and Yu Yuan sought the answer to the puzzle that is the beta anomaly with their February 2017 paper, “Absolving Beta of Volatility’s Effects.” Because this paper builds on their 2015 paper, “Arbitrage Asymmetry and the Idiosyncratic Volatility Puzzle,” which appeared in the October 2015 issue of The Journal of Finance, I’ll first review the findings of that study, which addressed the anomaly that stocks with greater idiosyncratic volatility (IVOL) have produced lower returns. This is an anomaly because idiosyncratic volatility is viewed as a risk factor — greater volatility should be rewarded with higher, not lower, returns.
Liu, Stambaugh and Yuan begin with the hypothesis that IVOL represents risk that deters arbitrage and the resulting reduction of mispricings. They then combine this concept with what they term “arbitrage asymmetry” — the greater ability and/or willingness of investors to take a long position as opposed to a short position when they perceive mispricing in a security. This asymmetry occurs because there are greater risks and costs involved in shorting, including the potential for unlimited losses.
The figure below, which is from the paper, highlights the concept:
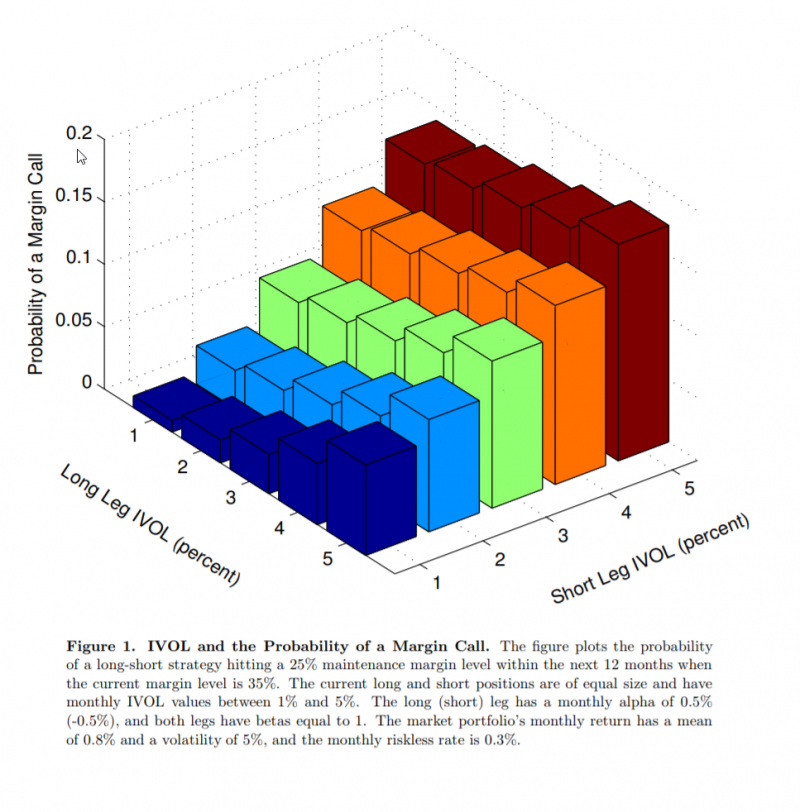
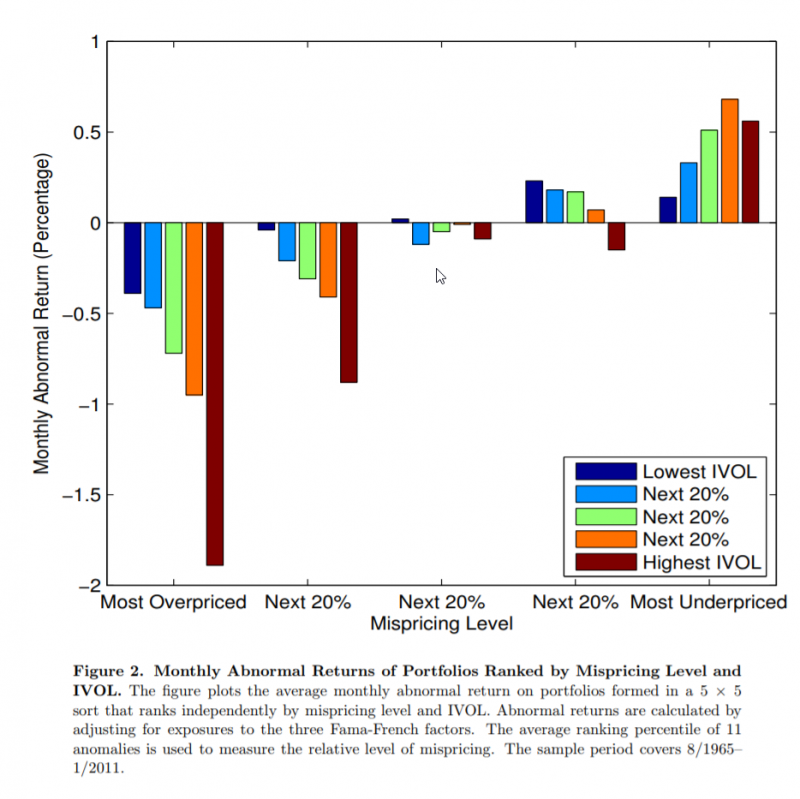
To see the effect of limits to arbitrage and arbitrage asymmetry, Stambaugh, Yu and Yuan note that stocks with greater IVOL, and thus greater arbitrage risk, should be more susceptible to mispricing that isn’t eliminated by arbitrageurs. Among overpriced stocks, the IVOL effect in expected return should therefore be negative. Stocks with the highest IVOL should be the most overpriced. However, with arbitrage asymmetry, the reverse isn’t true, as the greater willingness to buy (versus short) allows arbitrageurs to eliminate more underpricing than overpricing. The core results are highlighted in the following chart, again from the study, and show the hypothesized relationship between IVOL and mispricing.
The authors explain as follows:
As a result, the differences in the degree of underpricing associated with different levels of IVOL should be smaller than the IVOL-related differences in overpricing. That is, the negative IVOL effect among overpriced stocks should be stronger than a positive IVOL effect among underpriced stocks. When aggregating across all stocks, the negative IVOL effect should therefore dominate and create the observed IVOL puzzle.
Testing the Hypothesis
To test their hypothesis, Stambaugh, Yu and Yuan constructed a proxy for mispricing. Specifically, they established a composite measure averaging each stock’s rankings associated with 11 return anomalies that represent violations of the Fama-French three-factor (market beta, size and value) model:
- Net Stock Issues: Net stock issuance and stock returns are negatively correlated. It’s been shown that smart managers issue shares when sentiment-driven traders push prices to overvalued levels.
- Composite Equity Issues: Issuers underperform non-issuers with composite equity issuance defined as the growth in a firm’s total market value of equity minus its stock’s rate of return. It’s computed by subtracting the 12-month cumulative stock return from the 12-month growth in equity market capitalization.
- Accruals: Firms with high accruals earn abnormally lower average returns than firms with low accruals. Investors overestimate the persistence of the accrual component of earnings when forming earnings expectations.
- Net Operating Assets: The difference on a firm’s balance sheet between all operating assets and all operating liabilities, scaled by total assets, is a strong negative predictor of long-run stock returns. Investors tend to focus on accounting profitability, neglecting information about cash profitability, in which case net operating assets (equivalently measured as the cumulative difference between operating income and free cash flow) captures such a bias.
- Asset Growth: Companies that grow their total assets more earn lower subsequent returns. Investors overreact to changes in future business prospects implied by asset expansions.
- Investment-to-Assets: Higher past investment predicts abnormally lower future returns.
- Distress: Firms with high failure probability have lower, rather than higher, subsequent returns.
- O-Score: An accounting measure of the likelihood of bankruptcy. Firms with higher O-scores have lower returns.
- Momentum: High (low) recent (in the past year) past returns forecast high (low) future returns over the next several months.
- Gross Profitability Premium: More profitable firms have higher returns than less profitable ones.
- Return on Assets: Again, more profitable firms have higher expected returns than less profitable firms.
As evidence that their mispricing measure is effective, they found that after assigning stocks each month to deciles based on their measure, the following month’s spread in benchmark-adjusted (for the three Fama-French factors) returns between the two extreme deciles averaged 1.48 percent over their sample period (August 1965 through January 2011) and was highly statistically significant.
Sorting stocks based on this composite anomaly ranking allowed the authors to investigate the IVOL effect within various degrees of cross-sectional relative mispricing.
They found:
As predicted, the IVOL effect is significantly negative (positive) among the most overpriced (underpriced) stocks and the negative effect among the overpriced stocks is significantly stronger — the negative highest-versus-lowest difference among the most overpriced stocks is 3.7 times the magnitude of the corresponding positive difference among the most underpriced stocks.
They also found that the vast majority of the differences in returns were explained by the short side (the most overpriced stocks). In addition, IVOL increased monotonically moving across deciles from the most underpriced to the most overpriced.
Moreover, consistent with their model, they found that the negative IVOL effect among overpriced stocks is stronger for stocks that are less easily shorted (as proxied by stocks with low institutional ownership). The authors also found that while the IVOL effect was strongest among overpriced small stocks — consistent with small stocks being more difficult/expensive to short than large stocks — the effect holds for large stocks as well, though it’s no longer statistically significant at conventional levels. Again, this supports their hypothesis regarding limits to arbitrage and arbitrage asymmetry.
Stambaugh, Yu and Yuan also hypothesized that “when aggregating across all stocks, the average negative relation between IVOL and expected return observed by previous studies should be stronger in periods when there is a market-wide tendency for overpricing.” To test this hypothesis, they chose to use the sentiment index constructed by Malcolm Baker and Jeffrey Wurgler in their study, “Investor Sentiment and the Cross-Section of Stock Returns,” which appeared in the August 2006 issue of The Journal of Finance (discussed here).
Again, the evidence supports the theory:
The negative IVOL effect among overpriced stocks is significantly stronger following months when investor sentiment is high, and the positive IVOL effect among underpriced stocks is significantly stronger following months when investor sentiment is low.” In addition, there was “significantly stronger sentiment-related variation in the IVOL effect among the overpriced stocks.
The study from Stambaugh, Yu, and Yuan not only helps us to understand the role that idiosyncratic volatility plays in explaining returns, but it also helps us to understand why the anomaly persists. They show that “higher IVOL, which translates to higher arbitrage risk, allows for greater mispricing. As a result, expected return is negatively (positively) related to IVOL among overpriced (underpriced) securities.”
The authors also demonstrate that “the negative IVOL effect among overpriced stocks is stronger than the positive effect among underpriced stocks, and thus a negative IVOL effect emerges within the overall cross-section. In addition, among the overpriced stocks, the negative IVOL effect is steeper for stocks less easily shorted.”
IVOL Explains the Beta Anomaly
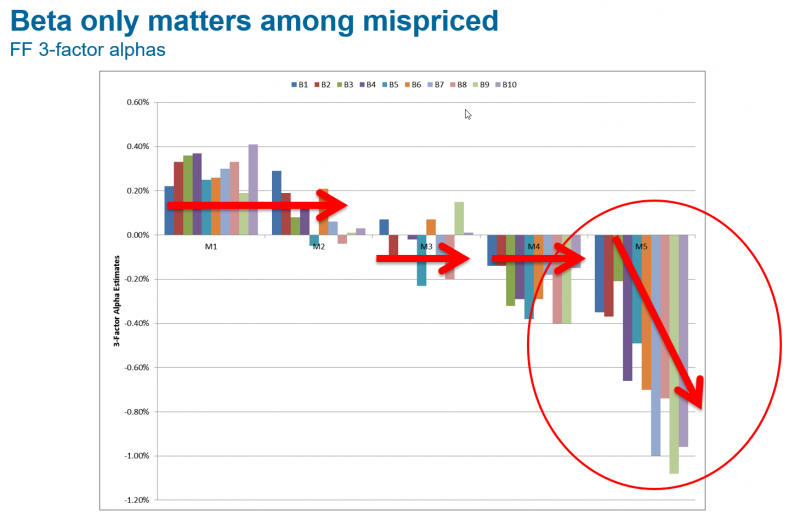
As previously mentioned, Stambaugh, Yu and Yuan built upon the preceding findings in their new study on the beta anomaly: “Absolving Beta of Volatility’s Effects.” They propose that “beta is not the stock characteristic driving the beta anomaly. Rather, beta suffers from guilt by association with IVOL.” Their data sample covers the period from January 1963 through December 2013. The following is a summary of their findings, with supplemental graphics from Wes, who was a discussant on the paper at the 2017 MARC academic conference.(Discussant slides are available here).
- The beta anomaly, negative (positive) alpha on stocks with high (low) beta, arises from beta’s positive correlation (0.33) with IVOL.
- The relation between IVOL and alpha is positive among underpriced stocks but negative and stronger among overpriced stocks. That stronger negative relation combines with the positive IVOL/beta correlation to produce the beta anomaly.
- The anomaly is significant only within overpriced stocks (it’s negative, and stronger, in underpriced stocks) and only in periods when the beta/IVOL correlation and the likelihood of overpricing are simultaneously high.
- For stocks in the top quintile of mispricing (M5 category below), the alpha spread between stocks in the top and bottom deciles of beta is -60 basis points (bps) per month, with a t-statistic of -2.82. Across the remaining four quintiles of the mispricing measure, the spreads were much smaller (from -25 bps to 18 bps) and statistically insignificant (t-statistics between -1.28 and 0.90).
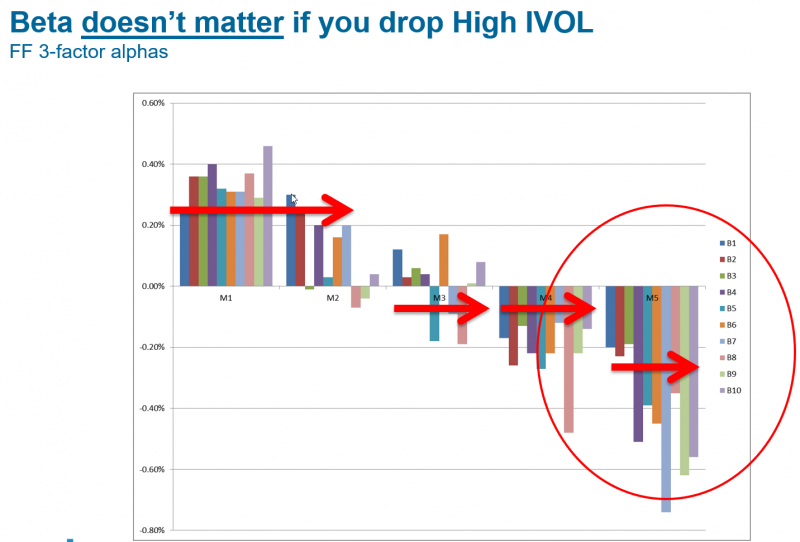
- Simply excluding overpriced stocks with high IVOL renders the beta anomaly insignificant (i.e., the three-factor alpha differences among beta deciles within a mispricing quintile are insignificant from one another).
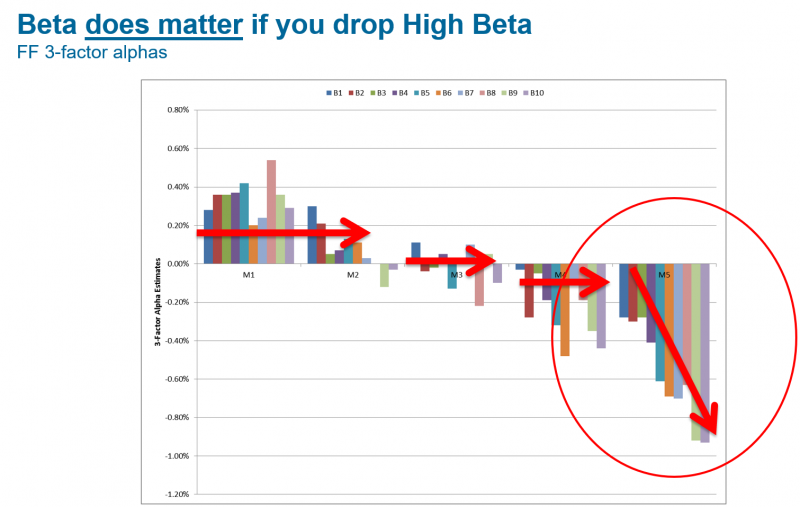
- The opposite is not true. If one excludes overpriced stocks with high beta, the beta anomaly still exists. Thus, betting against beta is driven by overpriced IVOL stocks.
- Deleting high-IVOL, overpriced stocks, just 7 percent of the stock universe (1 percent in terms of market value), also renders the beta anomaly insignificant. In contrast, deleting the 7 percent of stocks with the highest betas (5 percent in terms of market value) has virtually no effect on the beta anomaly.
- There’s a significant beta anomaly in periods when investor sentiment and the beta/IVOL correlation are both above their median values, but none when either or both quantities are below their medians.
Liu, Stambaugh and Yuan concluded:
The stronger negative relation among overpriced stocks is consistent with less capital available to bear the arbitrage risk of shorting overpriced stocks as compared to the capital that can bear such risk when buying underpriced stocks. The asymmetry in the strength of the positive and negative relations produces a negative alpha-IVOL relation in the total stock universe. That negative relation combines with the positive correlation between beta and IVOL to produce the negative relation between alpha and beta, the beta anomaly.
They add:
Beta-driven explanations of the beta anomaly seem challenged by our finding that the anomaly exists only among the most overpriced stocks.
Liu, Stambaugh and Yuan’s findings fit nicely with those of the June 2014 study by Bradford Jordan and Timothy Riley, “The Long and Short of the Vol Anomaly.” Their study, which covered the period from July 1991 through December 2012, was motivated by prior research that has shown both high-volatility stocks and stocks with high short interest exhibit poor risk-adjusted future performance. (While the “conventional wisdom” is that high short interest is a bullish signal because it predicts future buying from short covering, the reality is that stocks with high short interest perform poorly on average.) However, to that point, no one had studied the two together. The authors found that while, on average, stocks with high prior-period volatility underperformed those with low prior-period volatility, that comparison is misleading because among high-volatility stocks those with low short interest actually experience extraordinary positive returns. On the other hand, those with high short interest experience equally extraordinary negative returns.
Conclusions
The bottom line is that high volatility on its own isn’t an indicator of poor future returns. In fact, Jordan and Riley found, for the period from July 1991 through December 2012, stocks with high volatility and low short interest would have outperformed the CRSP value-weighted index by 9 percent a year. They also found that a portfolio long high-volatility and high-short-interest stocks had a four-factor alpha of -9 percent a year.
Another important finding was that high-volatility/low-short-interest stocks outperform the market in turbulent times, such as the dot.com crash and the 2007-09 financial crisis. During the dot.com bubble an equally weighted high-volatility/low-short-interest portfolio had an annualized compound return 3.5 percent greater than that of the CRSP value-weighted index. During the financial crisis, that same gap was 13.3 percent.
Taken together, the above findings provide investors with some important insights. Among them is the fact that there’s more uncorrected overpricing than uncorrected underpricing doesn’t mean a fund has to short an overpriced stock to benefit. The fund can benefit simply by avoiding the purchase of overpriced stocks with a filter that screens out stocks with the characteristic creating the mispricing. Passively managed, long-only mutual funds can put this knowledge to work by using screens to eliminate stocks that would otherwise be on their eligible buy list. It’s one way that Dimensional Fund Advisors, for example, has been adding value for decades. (Full disclosure: My firm, Buckingham Strategic Wealth, recommends Dimensional funds in constructing client portfolios.)
About the Author: Larry Swedroe
—
Important Disclosures
For informational and educational purposes only and should not be construed as specific investment, accounting, legal, or tax advice. Certain information is deemed to be reliable, but its accuracy and completeness cannot be guaranteed. Third party information may become outdated or otherwise superseded without notice. Neither the Securities and Exchange Commission (SEC) nor any other federal or state agency has approved, determined the accuracy, or confirmed the adequacy of this article.
The views and opinions expressed herein are those of the author and do not necessarily reflect the views of Alpha Architect, its affiliates or its employees. Our full disclosures are available here. Definitions of common statistics used in our analysis are available here (towards the bottom).
Join thousands of other readers and subscribe to our blog.


