“How can a q-theoretic model price momentum?” is a new paper by Robert Novy-Marx and goes right to the heart of an intense debate ongoing in empirical asset pricing — can neoclassic economic models explain the so-called momentum anomaly?
A quote from the start of the paper, which answers the question of “Can the investment CAPM price momentum?”
“The answer, of course, is that it can’t” — Sentence one of the abstract.(1)
So a reader quickly gets the answer!
This paper questions some of the findings in Lu Zhang’s Replicating Anomalies paper. For those unfamiliar with Lu’z research, we have highlighted the replicating anomalies paper here and Wes has a long interview with Lu here (as well as an interview on a podcast). High-level, Lu’s Investment CAPM (also know as the q-factor model) says that the cross-section of expected returns should be explained by two main factors, (1) Investment and (2) Expected Profitability.(2) Lu adds the market and size as the third and fourth factors when empirically examining the cross-section of returns.
In the Replicating Anomalies paper, Lu mentions that his model with his four factors can explain almost all of the anomalies! And the list is long, as they test 447 anomalies! A few of the factors that they can explain are (1) Gross-Profitability and (2) Momentum (both Price and Fundamental Momentum).
Enter Rober Novy-Marx.
Why?
Well, here are some of his papers:
- The Other Side of Value: The Gross Profitability Premium. (JFE 2013)
- Fundamentally, Momentum is Fundamental Momentum (working paper, described on our site here)
So basically, we have two academics arguing over whose factors is more important in explaining the cross-section of stock returns.
Hence, we have an academic war (of sorts).(3)
So does the Investment CAPM (i.e. the q-factor model) really price the (1) Gross-Profitability factor and (2) the Momentum Factor?(4)
We dig into the paper below to find out more …
The Paper Set-up and Results
The paper begins by highlighting two of the main results in the Replicating Anomalies paper:
- The “expected profitability” factor (as measured by ROE) yields significant excess returns, even as measured by the 3 and 4-factor models.
- The q-factor model prices Price Momentum (UMD).
This is shown in Table 1 of the paper (highlighted below):
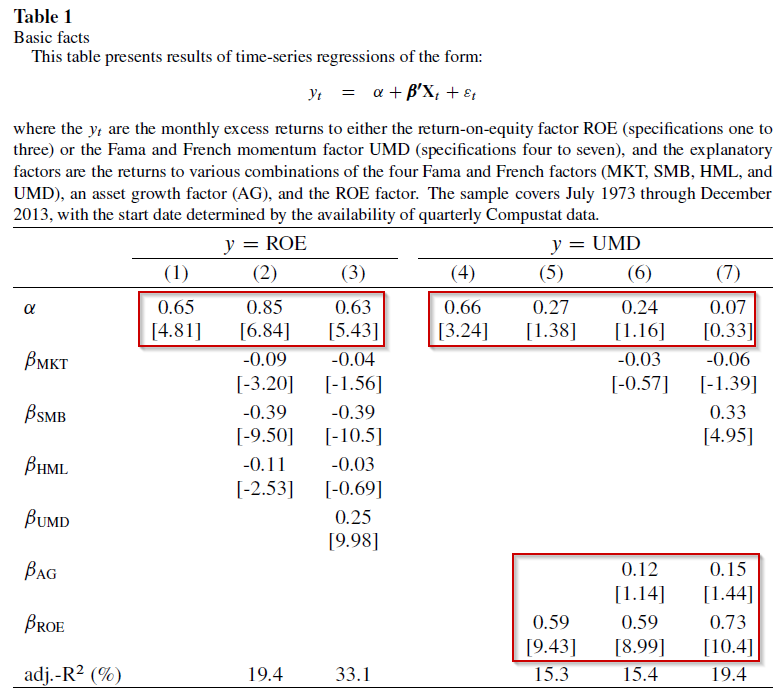
The results are hypothetical results and are NOT an indicator of future results and do NOT represent returns that any investor actually attained. Indexes are unmanaged, do not reflect management or trading fees, and one cannot invest directly in an index.
The first three columns highlight that Lu’s ROE factor (a measure of “expected profitability”) yields significant excess returns, both on its own (column 1) as well as in the 3-factor model (column 2) and the 4-factor model (column 3). This is found by noting the statistically significant alpha in row 1. Next, columns 4-7 highlight that while price momentum has excess returns on its own (column 4), when adding in the Investment CAPM factors, such as expected profitability (column 5–variable ROE) and Investment (column 6–variable AG), the excess returns to price Momentum (UMD) disappear.
Thus, Novy-Marx generates similar results to the Replicating Anomalies paper.
So why does the title of the paper, and the corresponding first sentence of the abstract, state that the q-factor model does not price momentum?
Herein lies a small distinction, which is “what does the ROE variable really measure”? According to Lu Zhang, this is a proxy for Expected Profitability. However, Robert has a different interpretation of the variable, done so by decomposing the variable into two components.
Before we dig into the decomposition, let’s first understand how the ROE variable is constructed. This variable is updated monthly and is generated by taking the most recent quarterly earnings number and dividing that by the lagged quarterly book equity. It is updated monthly to always be using the most recent data.(5)
However, as Robert points out, this variable can also be decomposed into two components–(1) lagged Earnings to Book and (2) Earnings Innovations
Mathematically, this can be described below, where IBQ is the quarterly earnings(6) and BEQ is the quarterly book equity:

In other words, we get the following:

So the ROE variable in Lu’s paper has been decomposed into two variables–(1) Lagged ROE and (2) Change in Earnings scaled by Book equity. The first variable is fairly straightforward, one-year lagged earnings over lagged book equity (lagged ROE). The second variable can be thought of as either (1) change in earnings scaled by book equity, or (2) earnings innovations scaled by book equity or (3) fundamental momentum.
So a natural question arises–of the two variables (lagged ROE and Earnings Innovations)–which one is most responsible for the excess returns? Or do both contribute to the excess returns?
Naturally, this is tested in the paper. Table 2 highlights the results to five long/short portfolios (from a set of 25 portfolios), created by varying the initial sorting variable. Panel A first sorts firms into quintiles on earnings innovations, and then re-sorts on lagged ROE. The five long/short portfolios are formed by going long the high lagged ROE quintile and going short the lagged ROE quintile, within each Earnings Innovations quintile.(7) Panel B reverses the order of the sorts–first sorting by lagged ROE and then sorting on Earnings Innovations.
So which variable is more important? The results are shown below in Table 2:
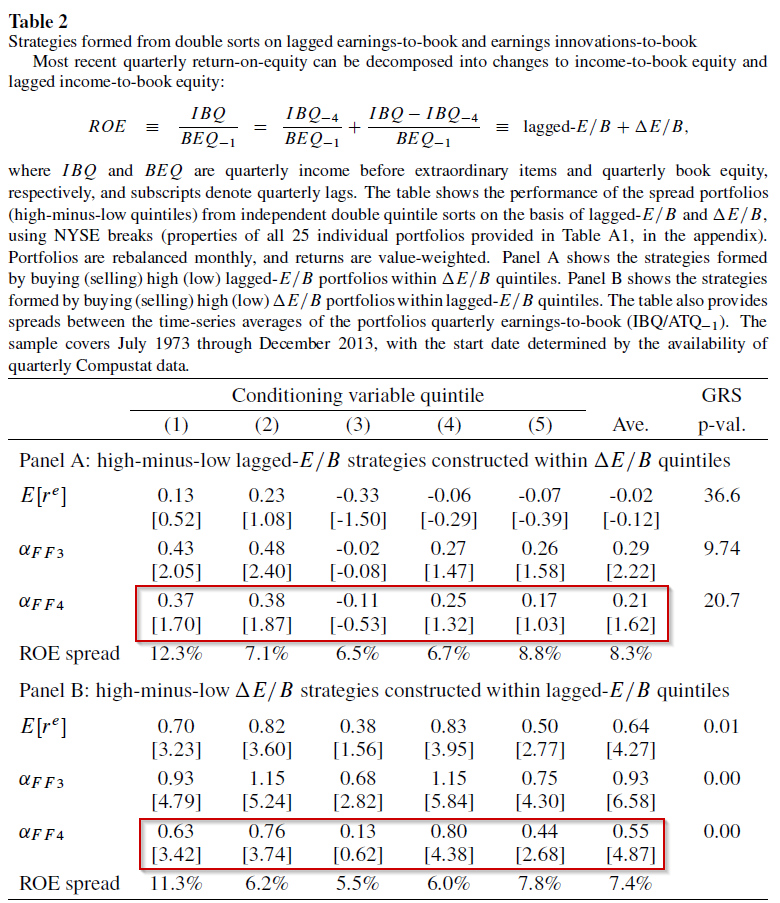
The results are hypothetical results and are NOT an indicator of future results and do NOT represent returns that any investor actually attained. Indexes are unmanaged, do not reflect management or trading fees, and one cannot invest directly in an index.
Panel A finds that the average excess returns are insignificant (as can be seen through the 4-factor alphas)–thus the lagged ROE does not appear to generate significant abnormal returns. However, Panel B finds significant excess returns–thus it is the Earnings Innovations that are generating excess returns.
So when one decomposes ROE into two variables, lagged ROE and Earnings Innovations (i.e. fundamental momentum), one finds that the significant excess returns appear to be driven by the fundamental momentum/Earnings Innovations.
To further bring home this point, Robert examines the long/short returns to five strategies:
- PEAD — Post Earnings Announcement Drift. Monthly-rebalanced portfolios on their SUE(8)
- Delta ROE — The Earnings Innovation/Fundamental Momentum described above
- ROE — The ROE variable used in the q-factor model
- E/B — Annually rebalanced Earnings/Book Value of Equity
- lag ROE — Lagged ROE as described above
The long/short portfolios are formed monthly (save the E/B portfolio) and are scaled to have the same volatility of the ROE factor (10.4%).(9)
Figure 1 highlights the growth of $1 in each of the 5 long/short portfolios.
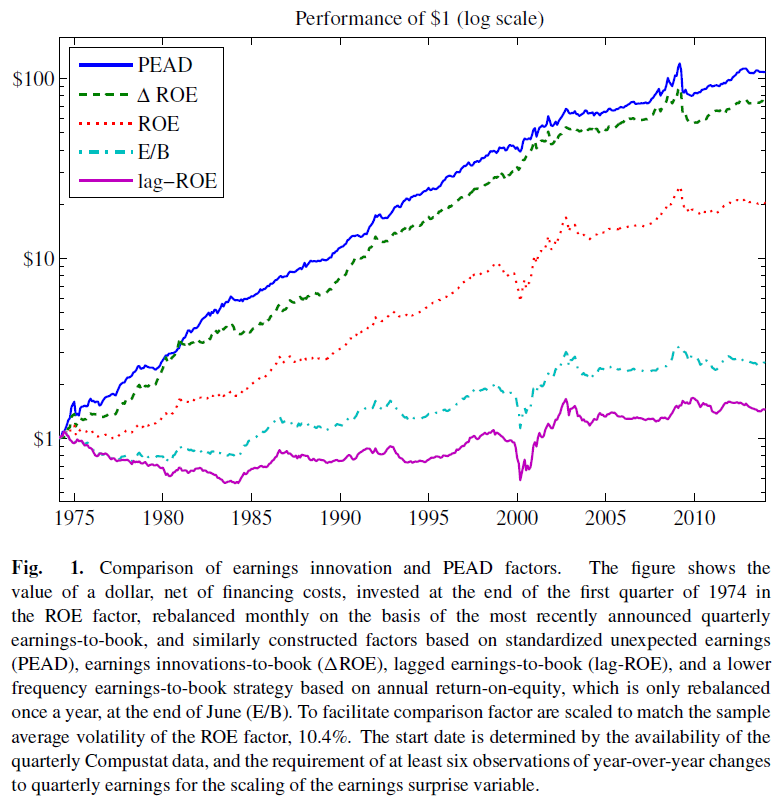
The results are hypothetical results and are NOT an indicator of future results and do NOT represent returns that any investor actually attained. Indexes are unmanaged, do not reflect management or trading fees, and one cannot invest directly in an index.
As is shown above, the two highest returns were the (1) PEAD and (2) Earnings Innovations/Fundamental Momentum portfolios. A related side note is that in the paper “Fundamentally, Momentum is Fundamental Momentum”, Robert uses SUE-formed portfolios as proxies for fundamental momentum.
Thus, the two variables with the largest returns are so-called fundamental momentum portfolios.(10) We notice that the ROE variable, which is part of the decomposed Earnings Innovation variable, comes in third, while the two static ROE variables (lagged ROE and E/B) come in last. Once again, the caveat of scaling the returns series up (or down) to have the same volatility as ROE will definitely have an impact on the invested growth path.
So is it the case that fundamental momentum, as measured by (1) PEAD and (2) Earnings Innovations, can price the ROE factor?
The best way to test this idea is to run cross-sectional regressions where we can control for other known factors, such as the market, size, and value.
This is done in Table 4, which is shown below:
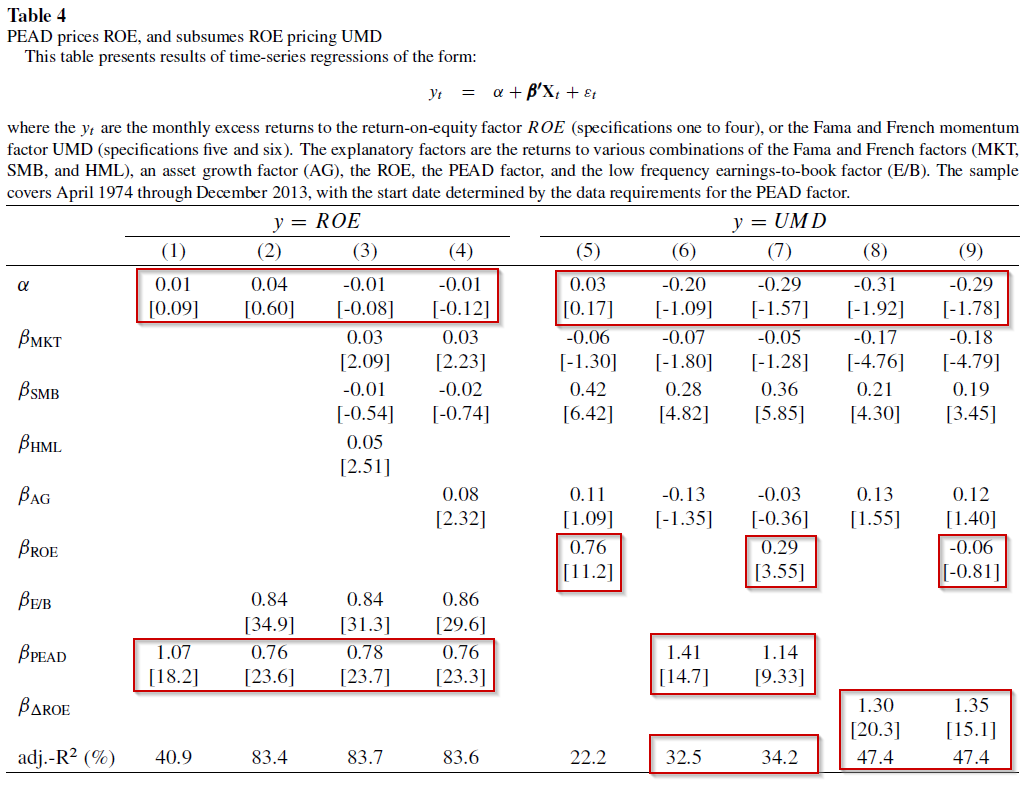
The results are hypothetical results and are NOT an indicator of future results and do NOT represent returns that any investor actually attained. Indexes are unmanaged, do not reflect management or trading fees, and one cannot invest directly in an index.
The results above are interesting and require a deep dive. The first four columns assume that the independent variable is the ROE portfolio, as described in the q-factor model. The four regressions highlight that once one accounts for fundamental momentum (using the PEAD variable), the ROE factor has an insignificant return! Thus, it appears that the excess returns to the ROE factor are accounted for by fundamental momentum.(11)
Regressions 5-9 now examine how well our variables–ROE, lagged ROE, PEAD, and Earnings Innovations–can price the typical “price momentum” factor (UMD). Below I highlight the results to each regression:
- Regression 5 generates the same results in the Replicating Anomalies paper, which is that the ROE factor can price the UMD factor (price momentum).
- Regression 6 finds that fundamental momentum (PEAD) also prices the UMD factor.
- Regression 7 finds that adding the ROE factor alongside PEAD only yields marginal ability to explain return variations (as seen by the R^2 barely increasing).
- Regression 8 finds that fundamental momentum (as measured by the Earnings Innovation factor) also prices the UMD factor.
- Regression 9 finds that adding the ROE factor alongside Earnings Innovations only no marginal ability to explain return variations (as seen by the R^2 not changing at all).
So what is the big-picture takeaway from regressions 5-9? In my opinion, the takeaway is that one can reasonably argue that fundamental momentum (as measured by PEAD or Earnings Innovations) is more important to pricing the UMD factor that the ROE variable. However, it is important to note that the ROE factor, by itself, embeds the Earnings Innovations factor and prices the Price Momentum (UMD) factor (column 5).
Remember that we started by noting that the q-factor claims to price two factors–momentum and gross profitability. The results above call into question the claim on momentum.
But what about gross-profitability?
This is examined in Table 5 of the paper, and the results are shown below:

The results are hypothetical results and are NOT an indicator of future results and do NOT represent returns that any investor actually attained. Indexes are unmanaged, do not reflect management or trading fees, and one cannot invest directly in an index.
The results above are regressions of the monthly rebalanced profitability variable against different factors. Columns 1 and 2 highlight that the profitability variable has excess returns (1) on its own and (2) against the three-factor model. Regressions 3-5 highlight that the q-factor model can price the profitability variable. This is seen as the excess returns are insignificant (examining the alphas). Last, regressions 6-7 examine the regressions with the ROE factor decomposed into its two parts. By decomposing the ROE factor into (1) lagged ROE and (2) earnings innovations, one cannot price Novy-Marx’s gross-profitability factor (while noting that lagged ROE has a very high loading on GP).
Conclusion
So the results above call into question the ability of the q-factor model to price two variables (momentum and profitability) common in the standard 6-factor model (the Fama and French 5-factor model + momentum). By simply decomposing ROE into its two components–lagged ROE and fundamental momentum (earnings innovations)–one finds different results than in the Replicating Anomalies paper. However, at the end of the day, if we pretend the q-factor model has 5 factors (not 4), by splitting ROE into (1) lagged profitability (i.e. lagged ROE) and (2) earnings innovations (i.e. fundamental momentum)–we would get similar results, in that both profitability and momentum (either measured by earnings or price) are important! Additionally, it should be noted that in Lu’s new working paper, “q^5”, they embed the Earnings Innovation/Fundamental Momentum variable into the 5th factor (this is “dROE” in the “q^5” paper).(12) An explanation of the new paper and factor can be found here.
So what is the big-picture takeaway? While it may appear that the two authors are competing, in my opinion, they have found similar results, but have different economic interpretations of those results. I don’t think that these findings discredit the Investment CAPM. However, these findings highlight that embedded within the ROE variable is a “fundamental momentum” variable, which appears important to pricing momentum in factor regressions.(13)
As we have mentioned before, and as the competing results above show, factor investing is more art and less science.
Let us know what you think …
How can a q-theoretic model price momentum?
- Robert Novy-Marx
- A version of the paper can be found here.
- Want a summary of academic papers with alpha? Check out our Academic Research Recap Category.
Abstract:
The answer, of course, is that it can’t. Hou, Xue, and Zhang’s (2014) empirical model does price portfolios sorted on prior year’s performance, but for reasons outside of q-theory—it does so by including a fundamental momentum factor, i.e., a factor based on momentum in firm fundamentals. The ROE factor, which does all the work pricing momentum, is constructed by sorting stocks on the most recently announced quarterly earnings, which tend to be high after positive earnings surprises. A post earnings announcement drift factor prices the model’s ROE factor, and subsumes the role the ROE factor plays pricing momentum portfolios when both are included as explanatory variables. The HXZ model also only prices portfolios sorted on gross profitability by conflating earnings profitability, which drives the ROE factor’s covariance with gross profitability, with post earnings announcement drift, which drives the ROE factor’s high average returns. Controlling for fundamental momentum, the HXZ model also loses its power to explain the performance of gross profitability. These facts are inconsistent with a neoclassical interpretation of the empirical model.
References[+]
| ↑1 | I took the liberty of describing the “q-factor” model as “Investment CAPM”. |
|---|---|
| ↑2 | Here is a link to where Lu outlines the Investment CAPM from the start |
| ↑3 | For those interested in other academic wars we have covered, here is (1) AQR versus the academics and (2) Trading costs wars |
| ↑4 | What does it mean to say that a model or a variable “prices another variable? Well, imagine that we have two variables, named variable A and variable B. When we run a baseline regression (regressing variable A and variable B against a model), we see that both have “excess” returns (after controlling for other factors, such as the market, Value, Size, etc.). If we then regress Variable A against a model (such as the 3-factor model) and also add Variable B as a dependent variable (to create a 4-factor model), if the addition of Variable B in the model causes the excess return (alpha) to disappear, we would say that Variable B “prices” Variable A. |
| ↑5 | I asked Lu what is the economic reasoning behind using a monthly rebalanced variable to proxy for expected profitability. Here is his response: “Using monthly updated Roe is easy to justify.
Suppose profitability follows an AR(1) process – a fairly innocuous assumption that is well established empirically, e.g., Fama and French (2000, Journal of Business). It follows that the latest known Roe (including recent earnings innovations) contains better information about future Roe than 4-quarter-lagged Roe.” |
| ↑6 | Income before
extraordinary items |
| ↑7 | So long/short portfolios are formed on the second sorting variable. |
| ↑8 | Standardized Unexpected Earnings. Here is the definition from the paper: “Standardized unexpected earnings (SUE) is calculated as the most recent year-over-year change in earnings per share, scaled by the standard deviation of the earnings innovations over the last eight announcements, subject to a requirement of at least six observed announcements over the two-year window. For earnings per share, I use Compustat quarterly data item EPSPXQ (Earnings Per Share (Basic) / Excluding Extraordinary Items). Earnings announcement dates are Compustat quarterly data item RDQ. |
| ↑9 | It is unclear if the other strategies were levered up or de-levered to achieve the same volatility. |
| ↑10 | I think both are accurately described. The first variable, earnings innovations, is explicitly examining the changes in earnings and scaled by book value of equity–one can view this as fundamental momentum (i.e. earnings momentum). The second variable, SUE, measures changes in earnings over the last year and scaled by the volatility of earnings–again, this is one way to measure earning (fundamental) momentum. |
| ↑11 | This is true with or without lagged ROE. |
| ↑12 | Note–this is not the exact 5th factor, but is used to create the 5th factor |
| ↑13 | For non-factor regressions, one finds a different result. The structural estimation shows that the expected investment growth is more important than the expected profitability in explaining momentum. See the detailed discussion on p. 20-22 in Goncalves, Xue, and Zhang (2017) — Thanks to Lu for pointing this out. |
About the Author: Jack Vogel, PhD
—
Important Disclosures
For informational and educational purposes only and should not be construed as specific investment, accounting, legal, or tax advice. Certain information is deemed to be reliable, but its accuracy and completeness cannot be guaranteed. Third party information may become outdated or otherwise superseded without notice. Neither the Securities and Exchange Commission (SEC) nor any other federal or state agency has approved, determined the accuracy, or confirmed the adequacy of this article.
The views and opinions expressed herein are those of the author and do not necessarily reflect the views of Alpha Architect, its affiliates or its employees. Our full disclosures are available here. Definitions of common statistics used in our analysis are available here (towards the bottom).
Join thousands of other readers and subscribe to our blog.