Replicating Anomalies is arguably a “must-read” for anyone who thinks about factor investing and is looking to improve their understanding of the space.
Lu Zhang, and his colleagues, Kewei Hou and Chen Xue, spent nearly 3 years carefully compiling and replicating 447 “anomalies” identified in the academic literature…

That’s a lot of programming and late nights burning the midnight oil on the CRSP/Compustat databases!
If you haven’t dug into the paper, I highly recommend it (there is a “how to read the paper” section in our previous post) Lu and his colleagues.(1)
The paper is not without criticism. For example, some academics I’ve spoken to believe that Prof. Zhang and his colleagues went overboard in highlighting that there is a “replication crisis” in finance. Their basic argument is that the, “Replicating Anomalies,” paper simply highlights that anomalies are concentrated in micro-cap and small-caps, a finding that was already well established (see Fama and French 2008). These critics suggest that the title should be, “Anomalies are Concentrated in Small-Caps,” or “Anomalies don’t work as well in non-small-caps.”
So perhaps there really isn’t a “replication crisis,” but rather, a need to analyze anomalies across different universes to ensure the results are robust. Simply publishing an anomaly that is centered on equal-weight portfolios that are heavily influenced by micro-caps won’t cut it.
To be clear, we also have plenty of disagreements with Lu Zhang when it comes to asset pricing. We believe behavioral bias can influence asset prices; Lu Zhang does not. We believe the value and momentum factors are partially explained by fundamental risk, but partially explained via systematic mispricing; Lu Zhang does not. We believe in limited arbitrage, slow-moving capital, and the ability for long-duration capital to exploit mispricing; Lu Zhang does not.
Bottom line? The “replication crisis” theme in the paper has rubbed some academic researchers the wrong way.
(2) And we think Lu is a little too “efficient markets” for our tastes. But that’s why Lu Zhang is such an important intellectual and why we seriously consider his ideas: He challenges our beliefs, makes us rethink our current processes, and helps us improve our understanding of finance. And he’s not only challenging our financial market beliefs…he’s challenging the Gods of academic finance with his ideas — to include just about every famous finance academic you’ve heard of (e.g., Fama, French, and Thaler).
With all those disclaimers upfront, let’s dive into our in-depth question and answer we had with Lu Zhang on everything “factor investing.”
Note: The conversation is fairly long, but you will hopefully learn a lot and possibly rethink your views on the factor investing world.
Factor Investing Conversation with Lu Zhang
Wes: Lu, first, just want to say thanks for taking the time to help our audience better understand your research. Also, on behalf of the “practitioner” community, I’d like to thank you and your colleagues for doing all this research so we can gain a better understanding of the markets.
Lu: Our pleasure, Wes. As professional academic researchers, our job is to conduct research that improves our understanding of how the world works.
Wes: So Lu, I’ve divided up the questions into 3 broad sections. Section 1 is related to questions directly associated with your Replicating Anomalies paper; Section 2 relates to critiques on your work; and Section 3 is my attempt to squeeze out practical insights related to your work so our readers can walk away with something actionable that can possibly improve their investment results in the future.
Lu: Sounds good.
Section 1: Follow-Ups on Your Replicating Anomalies Paper
Identifying factors and hunting anomalies is a fairly recent activity — Compustat’s first clean 10-K starts in 1962 and CRSP goes back to 1925 (see FF 1992 comments). The data are on US firms, a country that has experienced an incredibly unique run relative to human history.
What is the chance that we are all engaged in data-mining?
Data-mining is ubiquitous, alas. But better statistics and better economic theory can help. After an anomaly is published, replication by others is the key to establishing its reliability or credibility. Replication should be done with robust procedures and, if possible, on global data. In particular, we go through multiple rounds of internal replication before circulating a new working paper.
The analysis is all based primarily on decile sorts.
Is it possible that there are effects in the extremes? Say 5% buckets?
It’s possible, I suppose. We have not looked at portfolio sorts with 20 portfolios, but I doubt doing so would change materially our conclusion that most anomalies fail to replicate.
You mentioned on the podcast that you were working on the analysis for international markets. Can you share any preliminary insights? Anything dramatically different than what you’ve found in the US data?
Yes, we have a project in progress titled “Global q-factors” that aims to put the q-factor model in global data. Preliminary results (prior to internal replication) indicate that our investment and Roe (return on equity) premiums are reliable around the world. Averaged across countries, the investment premium is 0.36% per month (t = 2.84), and the Roe premium 0.55% (t = 4.73).
In terms of the performance of long-only products, an initial investment of $1 in January 1993 would grow to $13.43 in December 2015 for the big-cap-low-investment-high-Roe portfolio (one of the 18 benchmark portfolios behind the q-factors construction). For comparison, the MSCI big-cap index grows only to $5.39. In addition, an initial investment of $1 in June 1994 would grow to $28.91 in December 2015 for the small-cap-low-investment-high-Roe portfolio. For comparison, the MSCI small-cap index grows only to $4.95. The evidence suggests that our economic insight based on the investment CAPM clearly works in global data.
Going forward, we will carefully examine other anomalies in global data. As noted in the podcast, I believe global data are the future for empirical asset pricing.
Fast forward 50 years. We redo your study. Which factors are robust? Which factors no longer replicate?
I can only speculate what would happen in 2067. I would bet on value, momentum, investment, and Roe (as well as different combinations of these variables). Any other variables that are not related to investment and Roe, directly or indirectly, are unlikely to survive in the long run.
This answer reflects my faith in economic theory, as explained in this article. Guided by theory, in the q-factor model, we replace the value factor with the investment factor, and the momentum factor with the Roe factor. Theory says that the investment and Roe premiums are the natural consequences of value maximization of firms, when CEO/CFOs attempt to apply the net present value rule in capital budgeting. As long as managers try to maximize shareholder value, the investment and Roe premiums will survive in the long run.
In the podcast, I mentioned that momentum is stronger in developed markets like the U.S. than in emerging markets like China. Behavioral finance would have serious trouble explaining this evidence. Both mispricing and limits to arbitrage are more severe in emerging markets, meaning higher momentum profits. But the evidence shows otherwise. In contrast, the evidence is consistent with the investment CAPM. Managers in developed markets are more likely to apply the net present value rule to maximize shareholder value. In contrast, managers in emerging markets might have more issues related to corporate governance. I know Chinese managers tend to be appointed by the government, and are more interested in maximizing, for example, employment to ensure social stability than maximizing shareholder value.
You look at the original samples and then the full sample periods. One would presumably think that the full sample results may be influenced by the McLean/Pontiff “publication effect.” In other words, if the world knows about the anomaly and there are more computers, we may expect anomaly results to dampen. Can you speak to this and to any strong differences across the samples?
We do not see much of the McLean-Pontiff publication effect in our evidence. Here is what we wrote in our Replicating paper: “Our low replication rate of only 36% is not due to our extended sample relative to the original studies.
Repeating our replication in the original, shorter samples, we find that 293 (66%) anomalies are insignificant at the 5% level… Imposing the t-cutoff of three raises the number of insignificance further to 387 (86.6%). The total number of insignificance at the 5% level, 293, is even higher than 286 in our extended sample.”
More important, the McLean-Pontiff evidence is based on NYSE-Amex-NASDAQ breakpoints and equal-weighted returns. In preliminary results from a project in progress, we find that using NYSE breakpoints and value-weights, as well as more testing portfolios from our data library of 447 anomalies, the publication effect disappears. We see a lot of statistical bias that points to large sampling variations (and data-mining), but there exists no further publication effect.
Wow. We’d love to see the paper when you have it. The McLean-Pontiff “publication effect” paper tells a compelling story that many practitioners leverage to justify their investment approaches (e.g., dedication to passive market-cap indexes). Flipping this result on its head would certainly catch some attention.
Section 2: Critiques on the Replicating Anomalies Papers

You’ve been criticized by some big names — to include a tweet from the recent Nobel Prize winner Dick Thaler — that your paper’s conclusions are too strong broad because you boot out small caps.
A snippet from the Twitter conversation is posted below:
What do you think about these critiques?
A big, warm congratulation to Dick. Well deserved! Dick has opened our eyes to linking psychology to economics, despite heavy resistance in his early years. Dick is a role model for those of us whose scientific research puts us in a collision course with the status quo. Now that Dick is part of the status quo (and has been for a long while), I hope he can be as open-minded toward the next generation of big ideas as he hoped from his predecessors when he was young.
Regarding his critique on our Replicating paper, Dick is wrong. We did not boot out small caps. Even microcaps (smaller than small caps) are in our sample, but we assign value-weights to them to control for their impact. We show that once microcaps are properly controlled for, most anomalies cease to exist.
Also, the prediction that anomalies are stronger in smaller firms is not unique to behavioral finance. The investment CAPM literature has the same prediction, see this article, for example.
I should emphasize that we follow the bulk of the replication literature in economics in defining replication as different sample and perhaps similar but not identical specification. The crux is that finance is an observational science, not experimental. It’s infeasible to put the world economy into a deep recession to see what happens to our value and momentum strategies. Because observed data are accessible to all, we must focus on different empirical specifications to evaluate the reliability of our body of scientific evidence. This is exactly what we do in “Replicating anomalies.” The eight articles on replication published in the May 2017 issue of American Economic Review all adopt the same perspective.
You’ve mentioned on twitter that the table below summarizes eight years of your professional life.
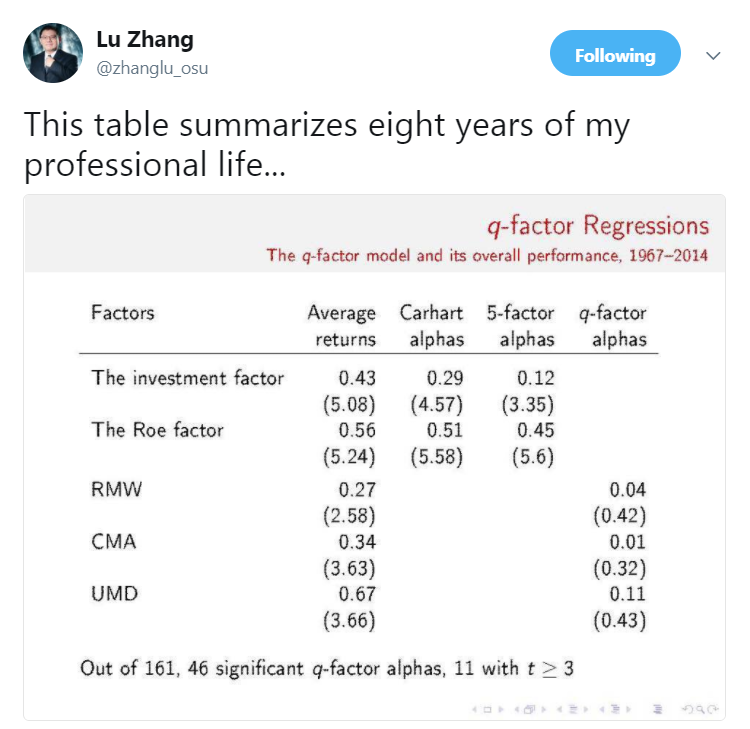
This table summarizes the so-called “factor wars,” which you explain in this interesting paper. Explain to everyday factor investors how to interpret this chart and why they should care?
This table summarizes head-to-head comparisons between our q-factor model with the Fama-French 5- and 6-factor models. The investment and Roe factors are from our q-factor model. Their average returns are 0.43% and 0.56% per month, respectively, and both t-values are above 5. Regressing our investment and Roe factors on the Carhart 4 factors and the Fama-French 5 factors fails to explain our factor premiums. Their 5-factor alphas, for example, are highly significant, 0.12% (t = 3.35) and 0.45% (t = 5.6), respectively.
The q-factor model fully explains the key factors in the Fama-French 5- and 6-factor models, including RMW, CMA, and UMD. Their average returns are all significantly positive, but their q-factor alphas are tiny: 4, 1, and 11 basis points per month, with t-values all below 0.5. The evidence suggests that RMW, CMA, and UMD are just noisy versions of our q-factors.
Investors should care about this evidence, when choosing which factor model to rely on in practice. The evidence shows that the q-factor model is more powerful than the Fama-French 5- and 6-factor models. If you are looking for a parsimonious model to control for common variation (risk) in the cross section of returns, the q-factor model seems the best in the academic literature. The data series of the q-factors are freely available from us. Just drop us an email.
This table is produced before Fama and French add UMD into their 5-factor model to form a new 6-factor model. We will provide more detailed comparison between the q-factor model and their 6-factor model in a future paper.
In addition to the better empirical performance, another important advantage of the q-factor model is its economic foundation, as explained in this article. Although the factor form is an approximation, the investment and Roe variables arise directly from the first principle.
In contrast, a glaring weakness of the Fama-French models is their lack of theoretical foundation. Their 3-factor model is purely empirical in nature. While useful in practice, the Carhart addition of UMD in the 4-factor model is also ad hoc. Fama and French (2015) try to put down a conceptual foundation based on the residual income model to motivate their 5-factor model. But we have shown in this paper that their conceptual arguments do not hold water. In particular, their version of the investment factor, CMA, can only arise from the investment-value relation, which is in turn a key insight from the investment CAPM. At last, their 6-factor paper has abandoned any conceptual discipline in adding UMD, having resisted it for 25 years.
As explained here and here (footnote 1, in particular, see below), I never wanted to fight with Fama and French.
I am aggressive, but not suicidal. Like everyone else, I desire to be socially accepted and liked. Being ostracized is painful to anyone. But my desire for social inclusion is not nearly as strong as my desire for intellectual honesty and scientific discovery. I have a tremendous amount of respect and admiration for Gene. But respect doesn’t mean worship. Admiration doesn’t mean obedience. I do what I think is the right thing to do in research. So help me God. The irony is that I fully agree with Gene on EMH. All I have done in research is to defend EMH. My research shows that EMH is closer to the truth than behavioral finance. Alas, I do not have full control of my own paper in the editorial process. I was dragged into the factors war by a senior behavioral finance referee before I was willing or ready. After tremendous professional and personal costs, I am by now willing, ready, and capable. And I will finish the job.
We wrote our own piece on factor models and highlighted that identifying the correct asset pricing models seems to be more art than science. Asness highlights that a higher frequency updated value factor (monthly rebalance) with up-to-date price information, keeps value alive, even when RMW and CMA are included in the regression?
I agree asset pricing is more art than science. There are so many open questions, which make asset pricing one of the most vibrant, but also controversial, fields in all of economics.
Yes, I’ve seen Cliff’s paper, which makes a lot of sense to me. Cliff is a pioneer and a hero in applying academic research to investment practice. I have a world of respect and admiration for him. I’ve watched one of his presentations on YouTube, in which he says he has a tendency to add gasoline to the fire when a fight breaks out. I can relate to that!
Coming back to Cliff’s paper, we have followed his insight by forming many monthly sorted value-minus-growth variables on up-to-date accounting and price data in “Replicating anomalies.” Whether doing so keeps value alive is still open, I think. The right comparison should be with an investment factor from monthly sorts on quarterly investment-to-assets. I also think this question whether value is alive after controlling for investment is more important in industry than in academia. The investment CAPM predicts a tight relation between investment and value (born out in the data). It is highly probable that a sharper measure of value can survive, even subsume, a coarser measure of investment empirically, and vice versa. But investment and value are forever tightly linked, thanks to the investment theory.
The Shleifer Vishny 1997 paper, Limits of Arbitrage, is extremely compelling to me because I see the principal/agent every day in the market. Limits of arbitrage is part of the behavioral finance story that explains why we can see inefficient prices, but nobody making piles of money trying to exploit these inefficient prices. I know you are more in the neoclassical camp when it comes to asset pricing.
Do you think about the behavioral finance arguments at all? What’s wrong with them? There seems to be a real “risk premium” associated with taking on career risk, that really would prevent prices from converging to fundamentals. Has anyone tried to model this? Perhaps expected portfolio returns = rf + fundamental_risk_premium + career_risk_premium?
I do think about behavioral arguments. I just find them unconvincing. Per Barberis and Thaler (2003), behavioral finance relies on mispricing and limits to arbitrage. Systematic mistakes by naïve investors give rise to mispricing, and limits to arbitrage prevent professional arbitrageurs from trading them away. Career risk would be part of the limits to arbitrage. However, decades of behavioral research have not shown us when naïve investors overreact, and when they underreact. And why they underreact to some variables, but overreact to other variables? In a recent survey, Lee and So (2015, Alphanomics) admit: “[B]e forewarned: none of these [behavioral] studies will provide a clean one-to-one mapping between the investor psychology literature and specific market anomalies. Rather, their goal is to simply set out of the experimental evidence from psychology, sociology, and anthropology. The hope is that, thus armed, financial economists would be more attuned to, and more readily recognize, certain market phenomena as manifestations of these enduring human foibles (p. 69).” In all, decades of behavioral research have not yield a behavioral asset pricing model that predicts forecastable pricing errors linked to specific anomaly variables, not to say rigorous tests of the model.
By revealed preferences, I am biased in favor of the investment CAPM literature, to which I have been devoting my academic career. I don’t like to be wishy-washy in research, which just indicates intellectual laziness to me. You’re supposed to evaluate the overall theoretical and empirical arguments diligently, and take a stand (and always stand ready to update your beliefs). In particular, our q-factor paper and value investing paper clearly show how specific market “anomalies” are in fact regularities in the investment CAPM, without any form of mispricing. And we have been subjecting the theoretical model to rigorous empirical tests.
On limits to arbitrage, our Replicating paper shows that trading frictions are just not that important in value-weighted returns. Now, if value and momentum exist in value-weighted returns (so do investment and Roe), but frictions don’t seem to matter in these returns, how is this evidence consistent with behavioral finance? If value-weights are relatively cheap to trade, why do value and momentum still show up? So many years after their initial discovery? Well, my take based on the investment CAPM is that value and momentum are equilibrium phenomena, which will persist regardless of how many arbitrage trades are placed on them.
Lu, let me interrupt and highlight my confirmation bias here, and thank you for making that statement regarding value and momentum. We hope you are right! But continue what you were saying…
I should acknowledge that equilibrium theories for momentum are less well developed than the theories for value. But we have good leads, and we are hard at work in developing them.
Finally, my sense is that behavioral finance has benefited greatly but unfairly from the failure of the consumption CAPM. At the beginning of their very interesting article titled, “The Great Divide,” Cliff and John Liew briefly mention that they think the consumption CAPM is largely irrelevant to the story they tell. Sad but true. The consumption CAPM is an empirical failure, which leaves room for behavioral finance to fill. However, I don’t believe behavioral finance is the answer, the investment CAPM is the answer. As I explain in this article, like any other prices, asset prices are equilibrated by both demand and supply. The consumption CAPM and behavioral finance, both of which are based on demand, cannot possibly be the whole story. The investment CAPM is a supply theory of asset pricing, long ignored by classic theorists. The failure of the consumption CAPM is largely due to the aggregation problem (the representative investor doesn’t exist), when working with aggregate consumption data. The micro-level consumption studies, such as those on household finance and individual investor behavior, make more sense to me, but they don’t say much about equilibrium pricing. The bottom-line is that the failure of the consumption CAPM with a representative investor doesn’t say much about EMH. The investment CAPM is my shot at solving Gene’s joint-hypothesis problem, and offers a powerful defense of EMH.
What do Fama and French think about this work? Have they given you any comments? How about others? Any good stories you can share?
There has been no direct line of communication between us and Fama and French. But after Thaler’s hostile response toward “Replicating anomalies,” I hope Gene can finally realize that I am in fact on his side all along. Before he and his top lieutenants beat me up further, just remember “friendly fire.” I agree with Gene much more than I agree with Dick. In fact, this article explains why I think Gene is fundamentally right, whereas Dick is fundamentally wrong.
We have indeed received several protesting emails from academics who work in the liquidity literature. But I think their work has vastly exaggerated the importance of liquidity in the equity market. Liquidity is likely important in corporate bonds, and definitely in mortgage-back securities. But we just don’t seem to see a large liquidity effect in equity returns.

Lu, I think you are picking your battles in a smart way. I’d much rather get in a street fight with Dick Thaler than Gene Fama. He’s probably got a few Jedi mind tricks up his sleeve. ha!
Okay. We’re on a roll here. My head is spinning with more questions — here’s another one for you. Juhani and Michael have an interesting robustness paper here. They make the following statement:
Our focus on these factors is motivated by Fama and French (2015) and Hou, Xue, and Zhang (2015) who show that these factors, in concert with the market and size factors, capture much of the cross-sectional variation in stock returns. We find no statistically reliable premiums on the profitability and investment factors in the pre-1963 sample period.
Care to comment?
Several responses:
First, they only look at Fama and French’s RMW. Our Replicating paper shows that the high-minus-low operating profitability decile does not earn a reliably positive return on average, even in the Compust sample. However, they do not have quarterly earnings data, which are required to construct our Roe variable. As such, their conclusion doesn’t apply to our Roe premium.
Second, more important, in the early years prior to 1963, the cross section is much narrower than that today, with many fewer names to play with. Some of the smaller average return spreads are simply mechanical.
Finally, recent data are more relevant than historical data. As such, I think the best way to conduct out of sample tests would be to look at global data. Based on our preliminary results, as noted, the q-factors stand tall.
Lu, here is a question from Twitter:
I come from a macroeconomics background, and as part of my studies we visited several models of investment adding frictions to the Q model of investment, such as adjustment costs, as empirically, investments decisions by firms do not adjust as quickly as the Q theory predicts.
Do these alternative models have any implications for risk premium?
Any thoughts on how adjustment costs affect the q model?
I am also from the macroeconomic background, having been trained at the Wharton Macro Finance group from 1998 to 2002. And long-standing values for macroeconomic research such as micro-foundations, rational expectations, structural modeling, and numerical methods are in my blood. These timeless values permeate my asset pricing research. I even cofounded Macro Finance Society in 2012, aimed at advancing the integration of macroeconomics and finance.
My article on the investment CAPM provides detailed answers to your questions. Adjustment costs are in fact the key to the predictions of my model. Without adjustment costs, Tobin’s q equals one. Without debt, the book-to-market equity also equals one, and consequently, is uncorrelated with investment-to-assets. In this case, the marginal costs of investment equal one, which is just the purchasing price of capital. This case is clearly unrealistic, as most firms have book-to-market less than one in the data.
With adjustment costs, the marginal costs of investment equal one plus the marginal adjustment costs, which are in turn an increasing function of investment-to-assets. In equilibrium the marginal costs of investment equal marginal q, which is just Tobin’s q. This mechanism explains why the investment factor is highly correlated with the value factor. This is the reason why we have never used the value factor ever since the first draft of the q-factor paper in 2007 (titled “Neoclassical factors”).
Adjustment costs are less essential for our Roe factor. Without adjustment costs, the stock return just equals the Roe. This equation in effect shows up in virtually all the dynamic stochastic general equilibrium (DSGE) models in macroeconomics. For a very long time, macroeconomists do not think about anomalies in financial markets. And when they do, they only work with the consumption CAPM, in which the first principle of real investment is absent.
On the other hand, many empiricists tend not to think in terms of, and are in fact hostile toward structural models.
Connecting theory with empirics, the investment CAPM emerges as a new asset pricing paradigm, which offers a supply theory of asset pricing. Most consumption CAPM anomalies turn out to be the investment CAPM regularities (see our q-factor paper). Although the investment CAPM does not rule out mispricing, it does show that mispricing is not necessary to explain anomalies. In fact, contrary to behavioral finance, which rides on market failures, “anomalies” reflect beautifully working capital markets per the investment CAPM.
Section 3: Practical Factor Investing Insights
Okay, that was pretty intense and I’m not sure many readers will make it to the best part of the conversation — how do we actually use all this knowledge to help us make some money!
Let’s play Factor Investing Fanatic — a game that I just made up. The goal is to name the genre of a factor and you name your favorite based on your work. Base your answer on what long-only portfolio will generate the highest expected returns over the next 20 years.
- Momentum?
- Value?
- Investment?
- Profitability?
- Intangibles?
- Trading frictions?
What say you, Lu?
Momentum: Prior 11-month returns
Value: Operating cash flow-to-price (Ocp in our notation in “Replicating anomalies,” 0.77% per month, t = 3.5)
Investment: Investment-to-assets (measured as asset growth)
Profitability: Return on equity (with monthly sorts per our q-factor paper)
Intangibles: R&D-to-market
Trading frictions: Nothing comes to mind, not important in value-weighted returns
Hrmm. Okay, so our Quantitative Momentum algo is close to your momentum measure, and our Quantitative Value algo, which essentially uses operating income/enterprise value is in the ballpark to operating cash-flow/price. Maybe we have some room for improvement, but I’ll take it!
…
Okay, now you have to choose 1 factor. You have a 20-year horizon and simply want to maximize your expected return on a long-only stock portfolio.
What factor do you use?
Roe, with monthly sorts on quarterly earnings scaled by one-quarter-lagged book equity.
Very interesting. Let’s arm you with 2 factors and risk some overfitting. Same question as above, but what are the 2 factors, and how do you weigh/combine them to create the portfolio? (e.g., 50% X, 50% Y).
Low investment and high Roe. The figure below is from an article that I have recently published at Tsinghua Financial Review (in Chinese, see here for its English translation). Say we invest $1 in the S&P 500 index fund in January 1967. This initial investment would growth to $117 by December 2014 (the black line). The blue line is for the big-cap-low-investment-high-Roe long-only fund that value-weights all NYSE, Amex, and Nasdaq stocks that simultaneously have market cap above the NYSE median, investment-to-assets below the bottom 30th percentile, and Roe above the top 30th percentile at NYSE. This fund grows to $369 by December 2014. Now, look at the red line, which is for the small-cap-low-investment-high-Roe long-only fund, which grows to $9,402! The annualized return is 20.5%. This fund value-weights all stocks that simultaneously have market equity below the NYSE median but above its bottom 20th percentile (no microcaps), investment-to-assets below the bottom 30th percentile, and Roe above the top 30th percentile at NYSE. You’ve got to love economic theory!
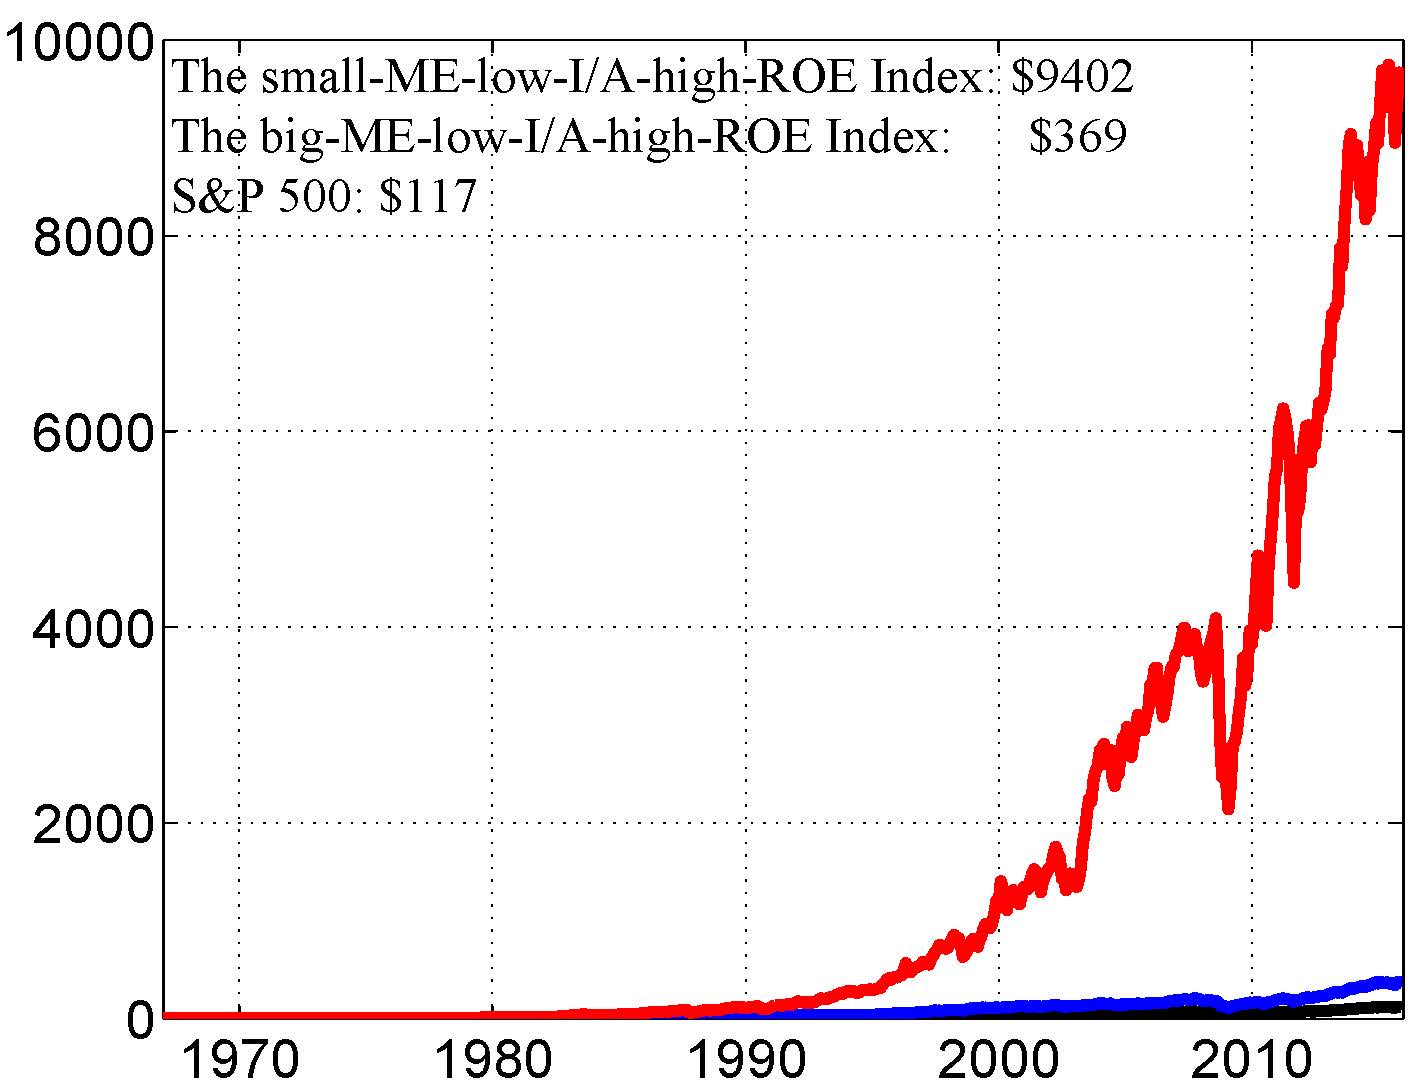
Wow. Not a bad chart. That is definitely a backtest that might turn on some investors. My only request is we do it on a log scale next time. Otherwise, Meb Faber may have a heart attack.
Also, I’m gonna take some liberty in the interpretation here, and talk our own book, but “low investment and high Roe” smells a lot like an investment process that focuses on cheap stocks with quality characteristics (to the extent the quality is correlated with Roe). Hint: the Quantitative Value Index.(3)
Okay, so you are a factor investing guru with insane asset pricing skills that probably put you in the top 1% of all finance researchers out there. Simple question: How do you invest your own money? Passive? Factor-based? Active? ETFs? Mutual Funds? And why?
Mutual funds, including index funds, and small and value funds. Passive. I am lazy. Research is an all absorbing job. And I don’t have enough money worthy of my time (or creative energy). I hope the situation can change soon in the future. :-)
Got it. So what you’re saying is you need to figure out how to find a pile of money and I need to be a better salesman! Roger that.
Clearly, you don’t have much time to invest your own money, but which investment products do you like in the market? Which products are questionable?
Value and momentum are good products. Quality works too, but its measurement is messy. Not all measures work (as show in our Replicating paper). Theory seems to suggest that the expected value and momentum premiums are time-varying, but factor timing in practice is hard.
Wait, I want to pause real quick and emphasize something that is up to considerable debate in practitioner-land: “factor timing in practice is hard.” Thanks for more confirmation bias. But continue…how about low volatility and/or low beta products? They are selling like hotcakes these days.
I am not sure about the low volatility and low beta products. I can see the enticement of these products to investors, seemingly promising low risk but high return. Wow, free lunch! But the Replicating paper shows that the low volatility anomaly is extremely fragile. And this paper shows that the low beta anomaly might be due to measurement errors in estimated betas.
When are we going to see a sweet data library like the one on Ken French’s website? We’ll host it — free IT support!
Soon!
We’re the big underdog in the factors war. Our intellectual opponents publish anything they write down, but we have had to code up 447 variables to get our voice heard. Despite strong resistance, we will get the job done. We’re on the right side of history. We have always had better economics, and also been gradually building toward better empirics. And we are patient.
At this point, our q-factors are freely available to anyone. Just drop us an email.
Okay Lu, you make the bad decision to retire from academics and decide to jump off a bridge and hang yourself start an asset management shop. You’re not AQR or DFA with hundreds of billions of dollars under management. You have a $100mm seed and no real capacity issues.
Do you run your factor portfolios equal-weight? Do you focus on smaller names? And if you do, what scale can you get to before you have market-cap-weight positions and move into bigger names? $500mm? $1B? $5B? $25B?
I would. I would focus on small caps, even microcaps, if I can trade smartly. Table 7 in our Replicating paper reports some numbers on investable capacity as a fraction of total market cap.
Got it. Here is a screenshot of the Table for those who are interested.
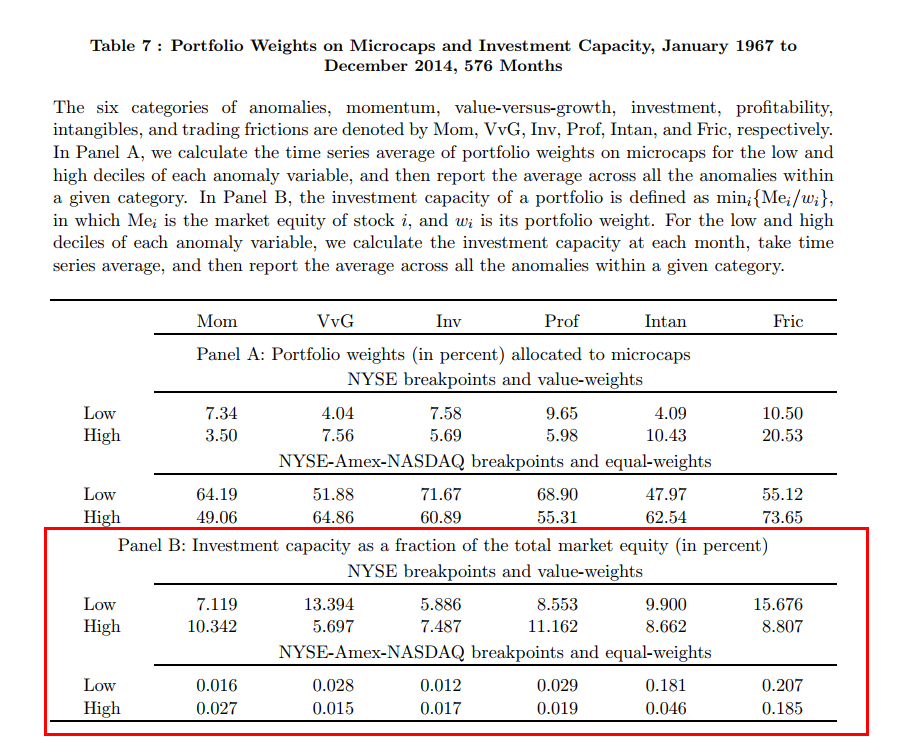
And here are the figures translated into actual investment dollars:
Table 7 Supplement: Investment Capacity ($billion)
| Mom | V-G | Inv | Prof | Intan | Fric | |
| NYSE breakpoints and VW | ||||||
| Low | 356 | 841 | 360 | 610 | 614 | 866 |
| High | 504 | 356 | 450 | 729 | 553 | 501 |
| NYSE/AMEX/NASDAQ breakpoints and EW | ||||||
| Low | .44 | 1.09 | 0.34 | 1.56 | 9.14 | 12.61 |
| High | .77 | .51 | 0.48 | 0.68 | 1.83 | 8.08 |
Clearly, factor investing anomalies — especially among smaller cap stocks and equal-weight portfolios — have scalability issues. And this is something we should recognize: trying to jam 10 pounds of stuff into a 1-inch hole can cause a problem!
Follow on. Let’s say you only work on a mid/large universe (we use 40% NYSE as a cutoff, ~$2B). So liquidity and micro/small aren’t huge issues. But now you EW everything vs VW. VW can arguably skew results when a stock like Apple ($500B+) is pooled with a $5B mid-cap. So EW is arguably more robust and less swayed by individual stocks dominating a decile portfolio sort.
I agree. We have experimented with all-but-microcap breakpoints and equal-weighted returns. The average return spreads are stronger than those with NYSE breakpoints and value-weights. We will report specific numbers in the next draft of our Replicating paper.
Thanks, that would be really interesting to see.
How would you implement these portfolios in real life? Academic portfolios are generally based on “sorts”, like deciles. We argue that focus/concentration, or academic sorts, are necessary to capture the true factor risk, and thus the true expected returns (at least for long-only). In other words, 50 stock factor portfolios versus 500 stock portfolios that are neutralized to everything and meant to minimize tracking error relative to a benchmark. But then you have the potential for industry concentration and other items of interest.
How should factor investors think about this?
I haven’t thought much about implementation details when running a fund. In academia, we strive to establish our empirical results with the most standard procedures. Otherwise we run the risk of data-mining, and are less persuasive. In real life, managers face certain institutional constraints, such as the maximum tracking error against a benchmark portfolio. I think some form of portfolio optimization is in order, i.e., to maximize the expected return subject to the constraints. But I would do robust portfolio optimization, as the 1/N paper makes me nervous.(4)
Got it. I guess us practitioners can try and add value via what the AQR team calls, “Craftmanship Alpha.” I’m glad you at least left one stone uncovered for us!
Lu. Thanks again. Incredible. Would love to pick your brain some more in the future. Also, where can folks find more about you on the web?
My website is a great place to start: http://theinvestmentcapm.com/research.htm
References[+]
| ↑1 | Jeremy Schwartz and I recently interviewed Lu Zhang on the Sirius/XM Behind the Markets podcast. We also posted a summary of his incredibly interesting paper, “Replicating Anomalies.” |
|---|---|
| ↑2 | There may be a grain of truth to this criticism, but this should be balanced with the natural instinct to not embrace ideas that shoot an arrow into one’s ego. |
| ↑3 | At least I hope we are close and I hope your q-factor model is the market truth! |
| ↑4 | See here for more information on this subject. |
About the Author: Wesley Gray, PhD
—
Important Disclosures
For informational and educational purposes only and should not be construed as specific investment, accounting, legal, or tax advice. Certain information is deemed to be reliable, but its accuracy and completeness cannot be guaranteed. Third party information may become outdated or otherwise superseded without notice. Neither the Securities and Exchange Commission (SEC) nor any other federal or state agency has approved, determined the accuracy, or confirmed the adequacy of this article.
The views and opinions expressed herein are those of the author and do not necessarily reflect the views of Alpha Architect, its affiliates or its employees. Our full disclosures are available here. Definitions of common statistics used in our analysis are available here (towards the bottom).
Join thousands of other readers and subscribe to our blog.