The Global Capital Stock: Finding a Proxy for the Unobservable Global Market Portfolio
- Gregory Gadzinski, Markus Schuller, and Andrea Vacchino
- Journal of Portfolio Management, 2018
- A version of this paper can be found here
- Want to read our summaries of academic finance papers? Check out our Academic Research Insight category.
What are the Research Questions?
What are the Academic Insights?
The authors compute the market value of global assets included in 11 asset classes for the 2005–2016 period. The article takes the viewpoint of a U.S.-based investor, with all numbers expressed in U.S. dollars.
Sources utilized:
- Public Equities: World Federation of Exchanges database (77 regulated exchanges across the world, representing approximately 45,000 listed companies). At the end of 2016, the United States represented 39% of the global market capitalization, down from 42% a decade earlier, with Europe decreasing from 28% to 19% and Asia expanding from 23% to 33%.
- Debt Securities: Bank for International Settlements (BIS) database (data on 40 countries on a quarterly basis with a six-month lag). From 2008 to 2016, the stock of government debt increased by 14% for the Eurozone, 51% for Japan, and 130% for the United States.
- Non-financial Loans: For securitized loans, data from the Securities Industry and Financial Markets Association (SIFMA) and the Association for Financial Markets in Europe (AFME) databases. For unsecuritized loans data from BIS.
- Cash and cash equivalents: It includes the components of money supply M1, which do not yield interest (i.e., currency in circulation and checkable deposits) and the components of M2-only (i.e., time and savings deposits, as well as money market deposit accounts for individuals). M3 components (i.e., money market funds, which typically invest in government securities, certificates of deposit, and commercial papers) are excluded.
- Real Estate and Forestry/Agricultural Land: OECD statistics, which gather historical annual data on the gross value of all types of land for a few countries, including Canada, Australia, Japan, the Netherlands, the Czech Republic, Korea, France, and Finland + Larson 2015.
- Private Businesses: Eurostat annual reports on SMEs. The authors apply the average valued-added to GDP ratio to the world GDP to determine the gross profits of private businesses worldwide. Then, using trailing 12-month gross margin ratios from the MSCI World Index, they derive for each year the revenues generated by privately owned firms. Last, they apply historical MSCI World adjusted price/sales ratios to obtain our estimates of the market values of privately owned companies worldwide.
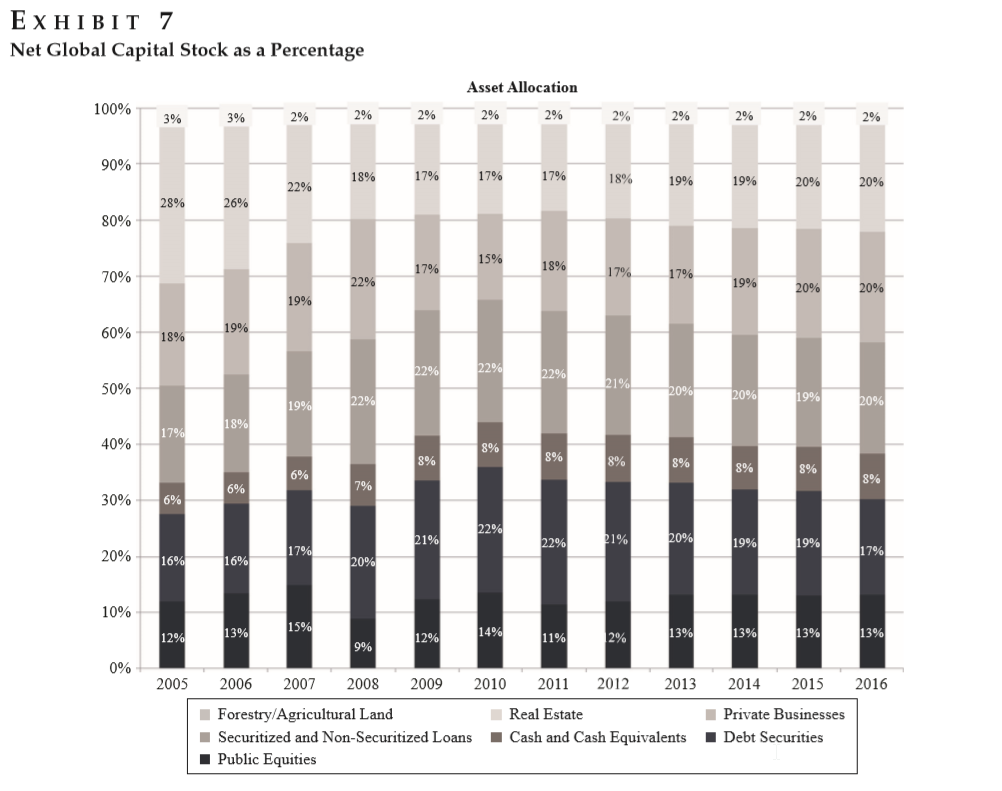
The authors’ proxy for the global market portfolio is estimated to reach $532 trillion in 2016, up from $512 trillion in 2015. Nonfinancial assets are still the largest component, with $223 trillion in 2016, representing 42% of the aggregated value. Real estate remains the dominant asset class, expressed as global home equity values of households and nonprofit organizations, with an estimated $107 trillion in 2016, a value greater than that during the peak of the real estate cycle in 2006. Nonetheless, its relative weight decreased from 28% to 20%, and this decline benefited all other asset classes equally. Real estate, private businesses, and loans to the private sector are almost equally weighted in the portfolio, whereas debt securities represent 17%; public equity, 13%; and cash and cash equivalents, only 8%.
Why does it matter?
Most benchmark solutions for multiasset strategies have typically focused on traditional financial assets, thus overlooking nonfinancial ones. The consequence is a partial picture of asset holdings. The global total return index could serve as a natural benchmark of a growing number of multiasset funds, estimated to be 34,000 worldwide (based on European Fund and Asset Management Association).
The Most Important Chart from the Paper
Exhibit 7 display the net global capital stock per asset class since 2005.

The results are hypothetical results and are NOT an indicator of future results and do NOT represent returns that any investor actually attained. Indexes are unmanaged, do not reflect management or trading fees, and one cannot invest directly in an index.
Abstract
Thirty-five years after the World Market Wealth Portfolio of Ibbotson and Siegel [1983], this article summarizes the authors’ attempt to measure the stock of a broad universe of assets worldwide. Therefore, by measuring the global capital stock of assets (both financial and nonfinancial) in the economy, the authors intend to provide a proxy for the theoretical global market portfolio. The authors compute the market value of global assets included in 11 asset classes for the 2005–2016 period. Despite the limited availability of data for nonfinancial assets, the authors argue that their proxy for the global market portfolio is a much-needed starting point for those willing to diversify away from traditional domestic portfolios and achieve global asset class diversification.
About the Author: Wesley Gray, PhD
—
Important Disclosures
For informational and educational purposes only and should not be construed as specific investment, accounting, legal, or tax advice. Certain information is deemed to be reliable, but its accuracy and completeness cannot be guaranteed. Third party information may become outdated or otherwise superseded without notice. Neither the Securities and Exchange Commission (SEC) nor any other federal or state agency has approved, determined the accuracy, or confirmed the adequacy of this article.
The views and opinions expressed herein are those of the author and do not necessarily reflect the views of Alpha Architect, its affiliates or its employees. Our full disclosures are available here. Definitions of common statistics used in our analysis are available here (towards the bottom).
Join thousands of other readers and subscribe to our blog.

